If you’re not tracking metrics, analyzing them, and tweaking your app accordingly, you’re missing out on potential optimizations that could dramatically improve customer experience. Setting mobile app KPIs (key performance indicators) for revenue, performance, and CX is an important first step toward accomplishing this. But there are tons of KPIs to choose from. How do you decide which ones are right for your app?
It’s important to figure out what your goals are with your app first, then your top KPIs accordingly. We’ve compiled a comprehensive list of the most popular KPIs that mobile app developers are using to measure (and solidify) their apps’ success. Depending on your app category and goals, some of these will be more applicable for you than others.
Downloads, new signups, and uninstalls
In 2021, mobile apps were downloaded more than 230 billion times globally. Downloads are the starting metric for most developers. It’s easy to understand, a great benchmark that many other metrics rely on, and a key stage of your app’s growth. It’s simple: the more frequently an app is downloaded from the app store, the more popular it gets.
Similar to downloads, tracking new signups can yield interesting insights. It indicates if your user base is growing or shrinking. This metric can be impacted by bugs, ad campaigns, recent events, and more. On the other hand, make sure you’re also tracking uninstall stats. This number can give you a more accurate picture of how many users are potentially using your app at any given time. When you see this rate grow uncomfortably large, you can start investigating the root cause: is it a feature that stopped working? Maybe your newest ad campaigns are sending the wrong message? Whatever the case, getting to the source of this issue is of paramount importance, and uninstall stats can shine a light on this matter and act as a starting point to help you investigate app health.
Customers don’t keep apps forever, so it’s important to track your app’s popularity with an accurate picture of the number of installs happening concurrently. At the same time, users often gravitate back towards their favorite apps, so don’t despair!
Retain, but don’t churn
Retention rate is the percentage of customers who visit or use your app at least once every 30 days. It is typically measured over the course of a 90-day period (one business quarter). It is an indispensable KPI because it indicates how many of your users have stayed loyal.
A high retention rate means your app is providing value for people, a great sign you should start monetizing your app. This metric is difficult to grow organically; therefore, retention numbers should be a major KPI from day one.

Churn rate is the opposite of retention rate. It tells you how many people stopped using your app. If your retention rate is 25%, it means your churn rate is 75%. You’ll want a low churn rate and a high retention rate, but that’s not always possible since mobile apps have high churn rates in general.
Customer engagement numbers
Research shows that mobile customers use nine apps a day and 30 a month, and the average U.S. consumer spent almost five hours on their smartphone every day in 2021. Sticky users are those who open your app frequently, sometimes even daily. They can be measured by app open rate (AOR) or session metrics.
You can also track daily active users (DAU) alongside AOR. These people form your core customer base, and if they start dropping off, you probably messed up somewhere. Active interest is shown when these customers go out of their way to tap on your app icon every day or interact with your app in another way. This is a strong indicator that you’re doing a great job with your app’s targeting and UX design.
Similarly, tracking monthly active users (MAU) shows how many unique visitors opened your app on a monthly timeline. This isn’t the same as monthly sessions, which will include returning users alongside new ones. Both DAU and MAU should measure the same, specific actions so they can be compared. A strong MAU means you can start monetizing your app with success.
Session statistics
Session length is a good KPI to use as a baseline for app engagement. It indicates how much time someone spends in your app per visit. The more time, the better because getting a customer’s attention is difficult enough as it is. Keeping their attention? That’s even more difficult to achieve.
While session length depends on the type of app, mobile consumers spend an average of about five minutes in a given app. But make sure you determine the averages for your particular app category. For instance, the average time spent in a payment app will differ from time spent in a shopping or meditation app. Session interval (SI) measures the time between sessions; shorter intervals are better, but it can depend on the nature of your app and whether your goal is to keep your customers coming back frequently. Often, app revenue, user retention, and advertising success are linked to SI rates. You can improve your SI numbers with better UX or more value for frequent visitors.
Sharing and rating your app
When people are passionate about an app and its impact on them, they’re more likely to share and rate it. It’s important to track sharing across social media, even if it means building a custom data pipeline to grab data from the major social networks. Track the context and reason for why the customer shared your app; sometimes, you can ramp up your efforts in the high-performing areas of the app.
With ratings, you really only need to track the app stores you’ve listed your app in. Don’t overlook any problem or complaint, and use this candid customer feedback as an opportunity to improve your app. Experts mention that it takes more time to write a review than rate an app, which speaks to the value of qualitative feedback. It can help you prioritize which suggestions to tackle first.
No missed opportunities
As important as it is to track engagement rates, retention rates, and actions, it’s all useless if you haven’t set up your app and tracking correctly. For example, if you’ve designed a slide-out menu that mistakenly contains unusable links, your customers will become frustrated and uninstall the app (or worse, leave a negative review). Make sure you’re tracking unresponsive gestures; these are gestures that people are attempting but not seeing any results from. Most developers aren’t thinking about customer frustration in this way, so you can set yourself apart from your competitors quickly by tracking unresponsive gestures with heatmaps.
On the other hand, crashed sessions are also incredibly frustrating. Customers will abandon your app if it keeps abandoning them. By tracking crashed sessions, you can nail down the cause and push a solution quickly. Crashed session metrics include how frequently crashes occur, when, and where in your app.
Mobile KPIs to monitor your competition on
APP DOWNLOADS BY REGION
There is no way to 100% accurately track competitors’ downloads by region, but you can gain a general idea through research. For instance, your competitor may announce their numbers in press releases (remember to take the brag factor into account). Use those numbers in partnership with their app ranking and compare the data with your own numbers and app ranking to form an idea of their downloads.
This information can help you define success for your own company. How many downloads is a realistic goal? 1,000 or 10,000 downloads per month? Use your competitors’ numbers as a starting point, and then focus on how to outgrow them.
APP PRICE IN REGION
There is a question that every company designing a mobile app must ask: free or paid? This is a tricky decision that competitive intelligence can help to answer. What are your competitors doing? If you plan to sell your app while the competition is offering a similar product for free, you must be sure that you are providing significantly more value.
APP RANKINGS BY REGION AND CATEGORY
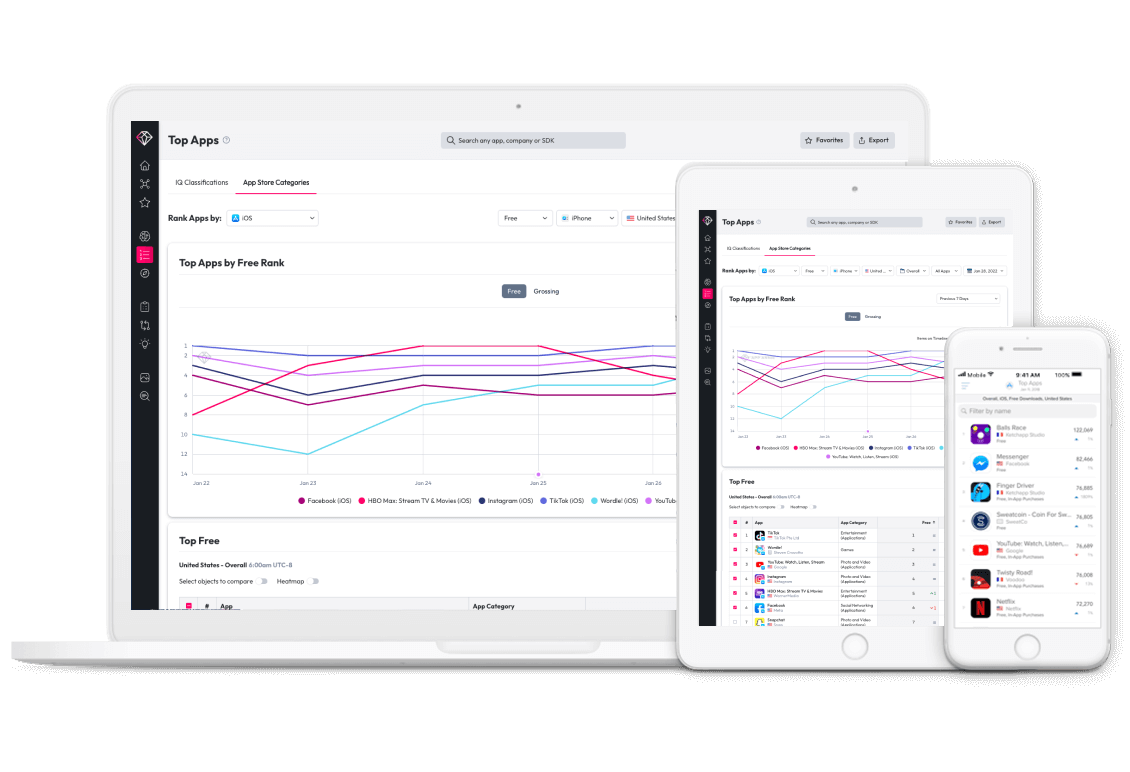
It is useful to track your competitor’s rankings and their relative positions. Has your ranking dropped while their rankings remained the same? This data is useful for analyzing customer feedback and marketing strategy. Of course, you could track this by hand, but we use and highly recommend Data.ai, which shows you app rankings for free.
UPDATE CYCLE
Understanding the update cycle is critical. You should know when your competitors update, and the purpose for each release. Was it a major revision or were they fixing bugs? If you detect a pattern, then you may be able to infer other information, such as the number of employees working on the app. This, in turn, could signal whether the app is a top priority, which could assist in deciding which resources to dedicate to your own app.
If you know the timeframe that their new features will be released, you can release your app with updated features first, even if it isn’t perfect, in order to get more downloads.
NUMBER OF CUSTOMER REVIEWS & AVERAGE CUSTOMER RATINGS
The number of reviews, average rating, and tone of reviews are all important, but even more interesting is how these values change over time. If the number of reviews increases greatly in a small period of time, or if their rating changes significantly, this can signal key strategy changes. If the ratings do not affect their position in the app store, it may mean that the reviews were purchased.
Conclusion
The bottom line? If you’re not tracking any KPIs, or even if you’re tracking the wrong ones, you could be hurting your own bottom line. Think of it this way: If you don’t know where you’re going, how will you get where you want to go?
It’s not enough to have a great app anymore. To have a successful mobile app these days, you must be constantly refining it for current and new customers. If you don’t, your competitors definitely will. On the other hand, if you do, you’ll be much more likely to achieve long-term success and customer loyalty.
If you would like to learn more about key marketing metrics and KPIs check our guide “6 New App Marketing Metrics.”
The post Mobile App KPIs: The Top Metrics to Measure App Performance appeared first on Alchemer.










Discussion about this post