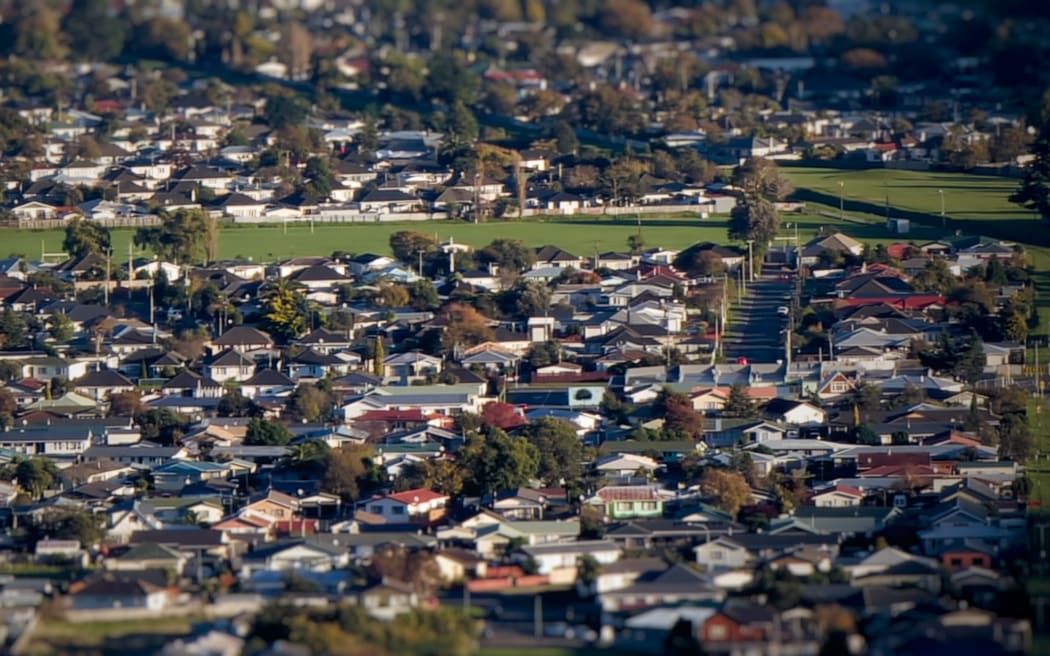
Household emissions fell in most regions of New Zealand between 2019 and 2021, the result less use of transport during Covid-19 restrictions, Stats NZ says.
Photo: 123RF
Greenhouse gas emissions have fallen in more than half of New Zealand’s regions, compared to 2019 levels, but emissions-intensive industries mean some regions are poor performers per capita.
Figures from Stats NZ released today showed the amount of gases that are harmful to the environment and which were released into the atmosphere reduced in 10 out of the 16 regions in New Zealand, between 2019 and 2021.
The data provides a comparison to pre-Covid-19 levels, showing the changes during a two-year period, between 2019 and 2021.
Stats NZ said this year’s report included a new interactive feature, which people could use to see which industries created the most emissions of the harmful gases in each region.
Where did emissions lower the most?
Stats NZ said the biggest reduction in greenhouse gas emissions in that period was in Taranaki, which released 18 percent less (1130 kilotonnes) of the gasses, which are known as carbon dioxide equivalents.
Auckland had the next most significant reduction, with 9.7 percent less of the harmful emissions (1049kt), followed by Northland, which emitted 16 percent less (781kt).
Stats NZ environmental-economic accounts manager Stephen Oakley said when looking at the changes, it was useful to break down where the emissions were coming from in each region.
“The decrease in emissions in Taranaki was largely due to a decrease in gas being used for electricity generation, followed by decreases in both manufacturing and mining.”
Taranaki’s emissions reached a peak in 2017 and have decreased since then. In particular, the region’s emissions specifically from electricity, gas, water and waste services went down 35 percent (454kt), the report said.
In Auckland, the 9.7 percent reduction in the emissions was largely due to less household emissions (down 16 percent), and manufacturing (down 10.2 percent).
Northland’s emissions were mostly from a reduction in emissions from manufacturing (down 34 percent).
Where did emissions increase the most?
Canterbury, Waikato and Gisborne were the worst regions for increases in emissions of the harmful gases between 2019 and 2021, the report said.
In Canterbury the emissions increased 3 percent (355kt), in Waikato 1 percent (182kt), and in Gisborne they increased by 4.9 percent (64kt).
Stats NZ said the Canterbury increase was largely from agriculture, forestry, and fishing (up 6.5 percent), and most significantly because the number of dairy cattle had increased.

High emissions industries, including agriculture, forestry and fishing, made notable contributions to the emissions levels.
Photo: RNZ/Sally Round
What changed in that two-year period from 2019 to 2021?
Stats NZ said overall, most of the changes in greenhouse gas emissions in the time covered by the report were from electricity, gas, water, waste services, manufacturing, transport, post, warehousing and household transport.
The big changes were in carbon dioxide emissions. Emissions levels of the other harmful greenhouse gases (methane and nitrous oxide) were mostly stable.
Did the amount of household emissions change?
Household emissions also lowered in the majority of regions between 2019 and 2021, with less household emissions of the harmful gases in 11 of New Zealand’s 16 regions.

Household emissions fell in many places between 2019, Stats NZ said.
Photo: Supplied/ Dan Bailey
Overall, New Zealand’s total household emissions fell by 9.6 percent (853kt) in that period.
Stats NZ put the reduction squarely down to Covid-19 restrictions.
“The large decrease in household emissions in this period is due to a general decrease in household transport emissions related to Covid-19 travel restrictions”, “Oakley said.
“In 2021, household transport emissions increased a little as lockdown restrictions eased but they are still below 2019 levels.”
The biggest reductions were in Auckland, Wellington and Waikato.
Auckland households emitted 16 percent less harmful green gases than previously (471 kt), Wellington households 14 percent less (114kt), and Waikato 5.6 percent less (64kt).
How do the figures break down per person?
When the measurements for 2021 were broken down by the number of people in each region, Southland and Taranaki were shown to have the highest levels of emissions per person.
There were 60 tonnes of the harmful gases emitted per person in Southland in 2021, and 40 tonnes per person in Taranaki.
Stats NZ said this was because of both relatively low populations and emission-intensive industries in these regions, such as agriculture, forestry, fishing and manufacturing, as well as mining in Taranaki.
Auckland’s high population (33 percent of the population, in 2021) and lower amounts of activity from high-emissions industries meant it was the best performing region for emissions per capita, at 5.7 tonnes of the gases per person.

Forestry was one of the relatively high emission industries, Stats NZ said.
Photo:


Discussion about this post