Solar radio bursts (SRBs) are sudden peaks in the low-frequency radio emissions originating from the sun. These emissions can also help predict space weather events that could have adverse effects on satellite communications and the global energy grid. A thorough understanding of this phenomenon demands the collection and analysis of solar emission data over vast geographical and time scales. In this regard, the e-CALLISTO network plays a major role through having already archived more than 20 years’ worth of SRB data. Leveraging on the advances in data analysis techniques, this data can be used to review the statistical significance of burst properties and hence more importantly the magnetic field measurements of the active regions. However, due to the irregularities from station to station and the background noise, the mass scale analysis is time consuming and challenging. In this project we introduced a GUI (Figure 1) application to analyze type II and type III SRBs.
Figure 1 The Graphical User Interface of the “Solar Radio Burst Analyzer — type II and type III. The executable (.exe) file of the GUI is available at https://github.com/YetsVihanga/Callisto-SRB-analyzer.git
Graphical User Interface (GUI)
The frequency drift rate analysis of SRBs is determined using easy-to-use Graphical User Interface (GUI). The program allows for the Flexible Image Transport System (fits) files of e-CALLISTO data to be imported from a local drive. The software contains several data reduction processes, visualization capabilities, the plot of frequencies of the highest intensities, the SRB isolation portal, the fitting model for the radio burst, and the drift rate curve of the burst. All CALLISTO receivers are identical with the number frequency channels (y-axis) and time channels (x-axis) corresponding to a grid of 200×3600. But these 200 channels of frequency can be set between any ranges of 45 MHz to 870 MHz. For example, In Sri Lankan station, we observe the SRBs in the frequency range of 45 MHz to 85 MHz. Thus, the calibration scale along the y-axis differs from station to station causing the isolation of SRB more complex. We address this issue in our application and user can crop the image according to the SRB detected. The IMG1 option in GUI (Figure 1) visualizes the raw spectrum and IMG2 option enhance and re-scale the color map in order to contrast the burst from the background which creates a clear image for identifying the burst’s time range and frequency range for the isolation. This option is given to visualize the intensity distribution of each frequency channel along the time axis through a graphical plot using IMG3. Isolation intervals and CROP can be used to isolate the SRB and the fine isolations can be done with FCROP. This GUI interface is mostly recommended for 64 bits versions of Windows 7 and above. This program is also compatible with Linux. For users who prefer any operating system other than Microsoft Windows, the python script can be downloaded from the website, “Git-hub”.
The following features were added in the GUI (Figure 1).
- Intensity graphs of individual frequency channels (IMG3)
- Crop and Fine Crop for isolating the radio burst at a smoother scale (Crop and F Crop)
- Display of the fitted model (Type II and Type III)
- Extract frequency drift rates and Goodness of fit (R2)
Frequency Drift Analysis
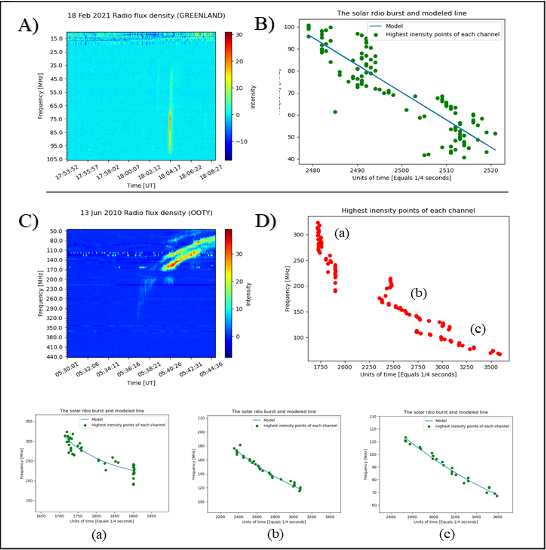
The application can be directly applied to Type II and III solar bursts. Once the highest intensities were identified as in (B) and (D) in Figure 2 the best fit model was generated. For the drift rate analysis, the slow drift type II radio bursts were fitted by exponential decay (Equation 1) and the fast drift rate type III radio bursts were approximated as linear decay (Equation 2). The mathematical expressions were given as follows.
$f= ae^{-({\frac{b+t}{t}})}+c$ (1)
$f= \frac{df}{dt}t+c$ (2)
Where, $f$= frequency, $t$ = time, $\frac{df}{dt}$ = drift rate, $a, b, c$ are function parameters.
Conclusion
The application is used to analyze several Type II and Type III SRBs and depending on the bust types, shock speed and electron velocity were determined. Therefore, the application is available to analyze more data in e-CALLISTO archive and hence improve the parameter analysis of SRBs statistically.

Figure 2 The figure shows two examples of the output images of the project. Panel A is a type III SRB and Panel B the linear model fit for the type III SRB. Panel C shows a type II SRB with fundamental and first harmonic. Panel D is the highest intensity points of the type II SRB. Subplots (a), (b)and (c) are the exponential model fits for the fundamental and first harmonic of type II SRB.
This nugget is based on the recent article: Yashan Hettiarachchi, Janaka Adassuriya, Chandana Jayaratne, Sasani Jayawardhana, and Christian Monstein. The analysis of type II and type III solar radio bursts: GUI for the e-CALLISTO data. New Astronomy volume 109, 2024. DOI: https://doi.org/10.1016/j.newast.2024.102194
References
Monstein, C., Csillaghy, A., O. Benz, A., 2023. CALLISTO solar spectrogram FITS files [data set]. International Space Weather Initiative (ISWI). http://dx.doi.org/10.48322/pmwd-mk15.
Benz A. O., Monstein C., Meyer H., Manoharan P., et al.: A world-wide net of solar radio spectrometers: e-callisto, Earth, Moon, and Planets 104 (1) (2009) 277–285.
Benz A. O, Monstein C., Meyer H., Callisto-a new concept for solar radio, arXiv preprint astro-ph/0410437 (2004)
Behlke R., Solar radio bursts and low frequency radio emissions from space, IRF Scientific Report 275 (2001)
Shanmugaraju A., Moon Y. J., Vrsnak B., Type II radio bursts with high and low starting frequencies, Solar Physics 254 (2009) 297–310. 12
Wijesekera J., Jayaratne K. P. S. C., Adassuriya J., Analysis of type II and type III solar radio bursts, in: Journal of Physics: Conference Series, Vol. 1005, IOP Publishing, 2018, p. 012046


Discussion about this post