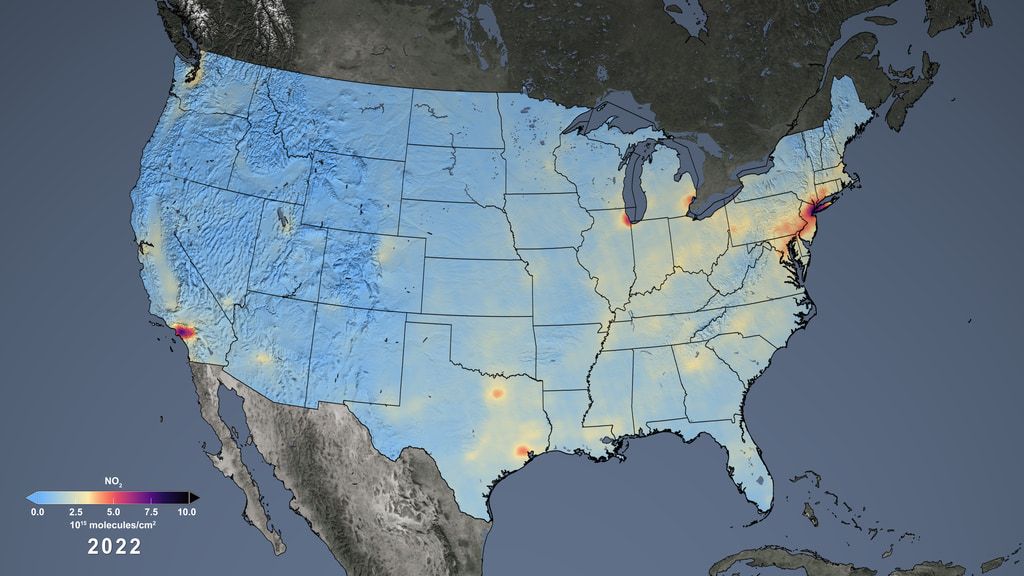
Scientists harnessed satellite technology to track a key air pollutant previously absent from a national database, NASA announced earlier this week, marking a crucial step forward in monitoring differences in air quality across the U.S. and identifying groups whose health is unfairly affected.
Measurements of nitrogen dioxide, which is primarily released into air through the burning of fossil fuels and can lead to respiratory diseases like asthma among other health problems, had been missing from the Environmental Justice Screening and Mapping Tool, or EJScreen. The database is maintained by the U.S. Environmental Protection Agency (EPA) and used by the organization as well as state and local agencies to account for vulnerable populations and neighborhoods with higher environmental burdens.
The Ozone Monitoring Instrument, or OMI, onboard NASA’s Aura satellite, which has provided Earth‘s air quality data for the past two decades, sees what human eyes cannot, including the potentially dangerous pollutants wafting in our air. From its vantage point in space, Aura had eyed the gaping ozone hole over Antarctica years ago and has followed its subsequent healing since an international ban on human-made chemicals was put into place. The satellite also gathered nitrogen dioxide values in the U.S. down to resolutions of 0.6 mile (1 kilometer), NASA said.
The information beamed home was then aggregated through a collaborated effort among scientists at NASA, EPA and three universities. The team averaged the data to census block levels, revealing the amounts of chronic gas people may be exposed to in their neighborhoods. The harmful pollutant is now displayed in simple color-coded maps in the fourth and latest version of EJScreen, which became available to the public early last month.
Related: Watch new NASA sensor measure US air pollution from space in real time (video)
“This tool democratizes access to high-quality nitrogen dioxide data, allowing individuals without a background in data analysis or data visualization to access and understand the information easily,” Gaige Kerr, an air pollution researcher at the George Washington University in Washington who was involved in incorporating NASA’s nitrogen dioxide data into EJScreen, said in a recent statement.
Users can choose to view specific communities on the EJScreen portal, which will then display a standard report that includes that area’s percentiles for several environmental pollutants and socioeconomic indicators, including populations of color, low income and unemployed groups, as well as those with limited English speaking abilities.
“Having access to this accurate and localized NO2 data allows organizations like ours to understand the air quality challenges we encounter, and to advocate more effectively for the health and well-being of community residents,” Samuel Jordan, the president of the Baltimore Transit Equity Coalition, said in the statement.
Over decades, evidence has piled up that marginalized communities breathe more polluted air because they live closer to air pollution sources including highways, factories, large transportation hubs, industrial areas and port areas. A recent analysis of satellite data concerning nearly 150,000 warehouses across the U.S. found that nearby nitrogen dioxide spiked by 20 percent on average primarily due to truck traffic, and that the increases are predominantly located in marginalized communities.
“Satellite data has the potential to transform the measurement of certain environmental and climate factors,” Tai Lung, an environmental protection specialist with EPA who leads the EJScreen tool, said in the statement. “The consistency of NASA’s nitrogen dioxide data for every corner of the U.S. makes it tremendously valuable for screening and mapping of disproportionate impacts in communities.”
In December 2022, the EPA updated the standards for heavy duty trucks in more than two decades, mandating their makers to cut nitrogen oxide pollution by 80 percent starting 2027.


/https://tf-cmsv2-smithsonianmag-media.s3.amazonaws.com/filer_public/34/31/3431771d-41e2-4f97-aed2-c5f1df5295da/gettyimages-1441066266_web.jpg)


Discussion about this post