


We just got the clearest snapshot yet of the first light that streamed through the Universe.
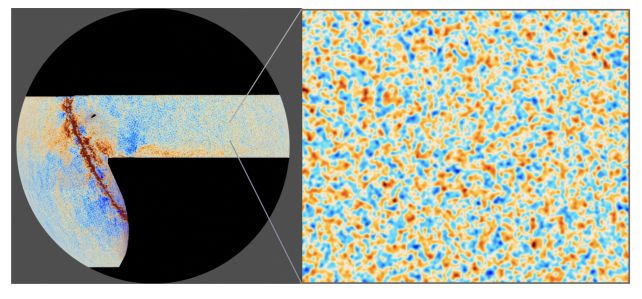
After five years of staring unblinking at the sky, the Atacama Cosmology Telescope (ACT) has compiled the most detailed map we’ve ever seen of the cosmic microwave background – the faint light that permeates the Universe from just 380,000 years after the Big Bang.
The results? We now have a clearer window into the infancy of the Universe, revealing with greater precision than ever how much mass exists in it, how large it is, and that the biggest crisis of cosmology – the Hubble constant – remains unresolved.
The findings have been detailed in three preprint papers uploaded to arXiv and the Princeton University ACT website.
“We are seeing the first steps towards making the earliest stars and galaxies,” says physicist Suzanne Staggs of Princeton University in the US.
“And we’re not just seeing light and dark, we’re seeing the polarization of light in high resolution. That is a defining factor distinguishing ACT from Planck and other, earlier telescopes.”
frameborder=”0″ allow=”accelerometer; autoplay; clipboard-write; encrypted-media; gyroscope; picture-in-picture; web-share” referrerpolicy=”strict-origin-when-cross-origin” allowfullscreen>
We can’t see all the way back to the Big Bang. The early Universe was filled with a thick, murky, opaque fog of ionized plasma. This medium was impenetrable to light; any photons moving through the darkness simply scattered off free electrons.
It wasn’t until about 380,000 years after the Big Bang that these particles began to combine into neutral gas, mostly hydrogen, in what is known as the Epoch of Recombination.
Once the free particles had been tucked away into atoms, light was able to spill forth, propagating throughout the Universe. That first light is the cosmic microwave background (CMB).
As you can imagine, some 13.4 billion or so years later, the CMB is very, very faint and low in energy, so it takes a lot of observation time to detect it, and a lot of analysis to tease it out from amid all the other sources of light in the Universe.
Compiling a map of the CMB has been the work of many decades, with the first all-sky map released in 2010, compiled from data collected by the Planck space telescope. Since then, scientists have been working to refine the map’s resolution so we can learn more about how our Universe was born.
This is what we have now with the latest data release from ACT, showing the intensity and polarization of the CMB with more clarity than ever. Polarization is the degree to which a light wave is rotated, which astronomers can decode to infer the nature of the environments the light has traveled through.
“Before, we got to see where things were, and now we also see how they’re moving,” says Staggs. “Like using tides to infer the presence of the Moon, the movement tracked by the light’s polarization tells us how strong the pull of gravity was in different parts of space.”
frameborder=”0″ allow=”accelerometer; autoplay; clipboard-write; encrypted-media; gyroscope; picture-in-picture; web-share” referrerpolicy=”strict-origin-when-cross-origin” allowfullscreen>
The CMB gives us a means of measuring the evolution of the Universe. We can look at the state of play now and at different times during the Universe’s history, and compare it to the CMB to chart the 13.8 billion years since the Big Bang.
“We’ve measured more precisely that the observable Universe extends almost 50 billion light-years in all directions from us,” says cosmologist Erminia Calabrese of the University of Cardiff in the UK, “and contains as much mass as 1,900 ‘zetta-suns’, or almost 2 trillion trillion Suns.”
Most of that mass is invisible. Normal baryonic matter makes up just 100 zetta-suns of the Universe’s mass. That’s everything we can detect – stars, galaxies, planets, people, black holes, gas, dust – all that stuff.
Of this normal matter, 75 zetta-suns are hydrogen, and 25 zetta-suns are helium. The rest of the elements in the Universe combined have so little mass that they don’t even make a dent in the pie chart.
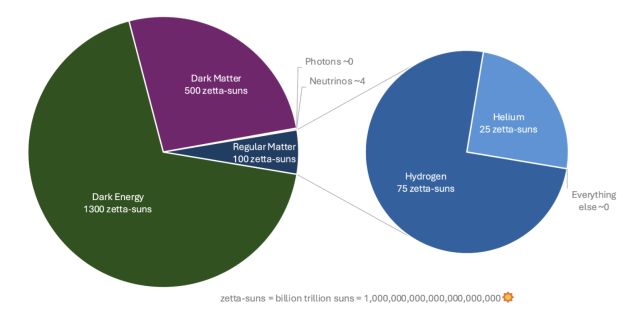
Another 500 zetta-suns make up invisible dark matter, the nature of which is unknown. The remaining 1,300 zetta-suns constitute dark energy, the name we give to the invisible force pushing space to expand faster than we can see.
This brings us to the Hubble constant, which represents the expansion rate of the Universe.
We go into the minutiae in more detail here, but the short version is that measurements of the distant Universe based on data such as the CMB show a slower expansion rate than measurements of the local Universe based on data such as supernovae. The former is around 67 or 68 kilometers per second per megaparsec, the latter around 73 or 74 kilometers per second per megaparsec.
It’s pretty fascinating, and worth reading about further if you have the inclination, but the upshot of this tension is that astronomers are trying to take better and better measurements of the Universe to try and close the gap between the two measurement ranges.
The new map of the CMB gave a Hubble constant of 69.9 kilometers per second per megaparsec. It’s one of the most rigorous measurements yet, and in good agreement with other values for the Hubble constant based on the CMB.
“It was slightly surprising to us that we didn’t find even partial evidence to support the higher value,” Staggs says. “There were a few areas where we thought we might see evidence for explanations of the tension, and they just weren’t there in the data.”
So that’s still a problem that needs to be resolved. But the repeated, rigorous calculations seem to be increasingly hinting that either there’s something crucial we’re missing, or the Universe is quite a bit weirder than we thought.
But that blobby, orange-and-blue map is bringing us closer to figuring it out, a testament to the insatiable curiosity and tireless ingenuity of human science.
“We can see right back through cosmic history,” says astrophysicist Jo Dunkley of Princeton University. “From our own Milky Way, out past distant galaxies hosting vast black holes, and huge galaxy clusters, all the way to that time of infancy.”
The three papers have been uploaded to arXiv and are available on the Princeton website.


Discussion about this post