The first half of 2023 has been extremely warm worldwide as a developing El Niño event on top of human-caused climate change helped drive temperatures into record-breaking territories.
Extreme heatwaves have swept many parts of the world, with 2023 now more likely than not to be the warmest year since records began in the mid-1800s.
After a relatively cooler start to the year due to an unusual “triple dip” La Niña event, the world has witnessed an increasingly strong El Niño event that contributed to record-setting temperatures in June and July.
In this latest “state of the climate” quarterly update, Carbon Brief finds:
- Both June and (very likely) July 2023 exceeded prior record average global temperatures for the month by close to 0.2C and 0.3C, respectively.
- 2023 is now more likely than not to be the warmest year on record.
- The world, as a whole, has warmed approximately 1C since 1970 – and 1.1C to 1.3C since the mid-1800s.
- A strong El Niño is developing and is expected to persist until early to mid-2024 in the majority of El Niño Southern Oscillation (ENSO) forecast models.
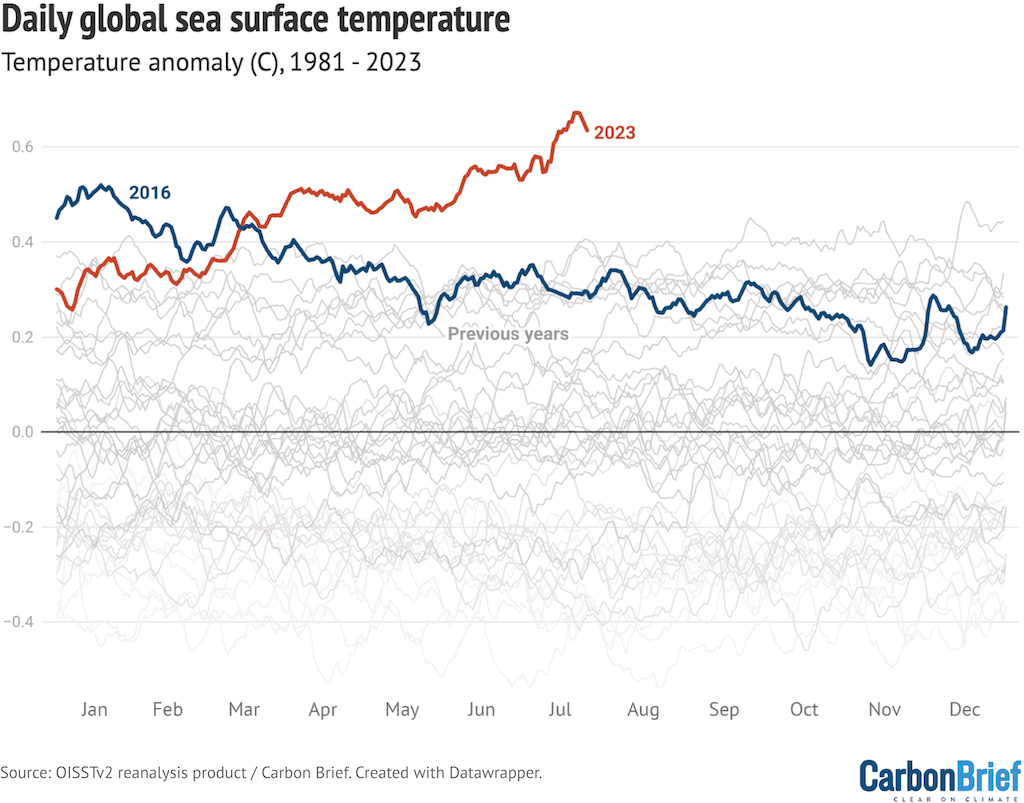
- Sea surface temperatures have been at record levels over the world’s oceans since mid-March.
- Extreme global temperatures in 2023 have contributed to heatwaves, wildfires and heavy rainfall worldwide.
- Global temperatures are closely aligned with the projections from climate models.
- Antarctic sea ice reached record lows in February and is currently exceptionally far below average for this time of year, while Arctic sea ice remains at the low end of the historical range.
Growing El Niño is driving up global temperatures
While human emissions of CO2 and other greenhouse gases are responsible for effectively all of the Earth’s long-term warming, temperatures in any given year are strongly influenced by short-term variations in the Earth’s climate that are typically associated with El Niño and La Niña events.
These fluctuations in temperature between the ocean and atmosphere in the tropical Pacific help make some individual years warmer and some cooler. This year started out slightly cooler than recent years due to an unusual “triple dip” La Niña event, with cool conditions in the tropical Pacific pushing down global temperatures.
However, this has rapidly transitioned into an increasingly strong El Niño event in recent months, contributing to record-setting global temperatures in June and July.
In this latest quarterly state of the climate assessment, Carbon Brief analysed records from five different research groups that report global surface temperature records: NASA’s GISTEMP; NOAA’s GlobalTemp; Hadley/UEA’s HadCRUT5; Berkeley Earth; and Copernicus/ECMWF.
The figure below shows the annual temperatures from each of these groups between 1970 and present, with the year-to-date 2023 temperatures for each record shown as individual points.
Annual global mean surface temperatures from NASA GISTEMP, NOAA GlobalTemp, Hadley/UEA HadCRUT5, Berkeley Earth and Copernicus/ECMWF (lines), along with 2023 temperatures to date (January-September, coloured shapes). Each series is aligned by using a 1981-2010 baseline, with warming since pre-industrial based on HadCRUT5 values from the 1850-1899 to 1981-2010 periods. Chart by Zeke Hausfather for Carbon Brief using Highcharts.
There is strong agreement between the different temperature records, with all of them showing approximately 1C warming between 1970 and present.
Global temperatures have been around 1.2C above pre-industrial levels in recent years (with a range of 1.1C to 1.3C across the different temperature datasets, reflecting that the differences between them are larger in the 1800s and early 1900s).
The figure below shows how global temperature so far in 2023 (black line) compares to prior years (coloured lines) in the Berkeley Earth dataset. For all previous years, it shows the temperature of each month, from January through December.
In the Berkeley Earth dataset, 2023 had a cooler start, but recent months have been close to record warmth and June set a new record by a large margin (~0.2C) as the warmest June since records began in the mid-1800s.

Temperatures for each month from 2015 to 2023 from Berkeley Earth. Anomalies plotted with respect to a 1850-1899 baseline. Chart by Zeke Hausfather for Carbon Brief using Highcharts.
January 2023 was cooler than most of the Januarys in the past decade due to the lingering effects of La Niña, coming in at the 7th warmest on record in all datasets. February was the 4th to 5th warmest, while March was the 2nd warmest March on record. April and May were 3rd to 4th warmest, while June was the warmest on record by a large margin in all datasets.
The respective rankings of each month in each dataset are shown below.
| GISTEMP | HadCRUT5 | NOAA | Berkeley | Copernicus | |
|---|---|---|---|---|---|
| Jan | 7 | 7 | 7 | 7 | 7 |
| Feb | 4 | 4 | 4 | 4 | 5 |
| Mar | 2 | 2 | 2 | 2 | 2 |
| April | 4 | 4 | 4 | 4 | 5 |
| May | 3 | 3 | 3 | 4 | 3 |
| June | 1 | 1 | 1 | 1 | 1 |
Rankings of 2023 global temperature by month across different datasets.
While the start of 2023 was cooled by La Niña, an El Niño event has developed over the past few months that is expected to strengthen in the latter half of the year.
The figure below shows a range of different ENSO forecast models produced by different scientific groups. The values shown are sea surface temperature variations in the tropical Pacific – the El Niño 3.4 region – for three-month periods.
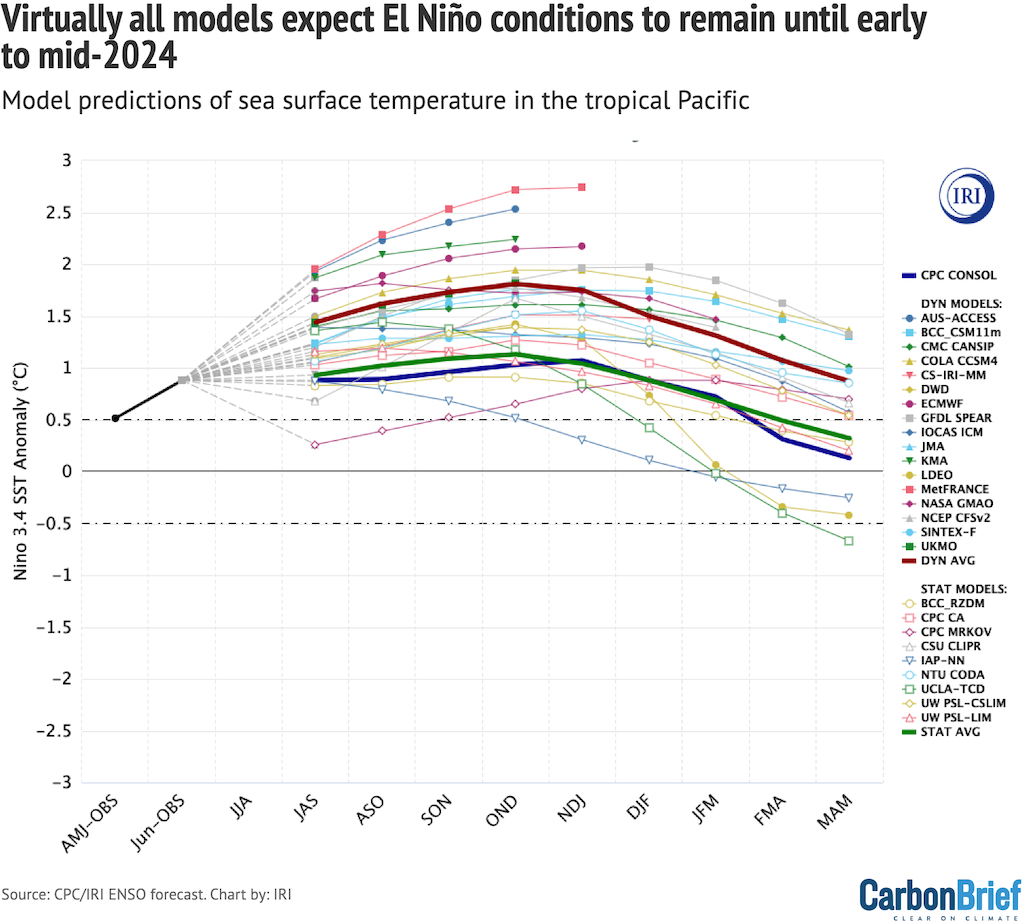
Virtually all models expect El Niño conditions to remain until early to mid-2024. Many models expect a strong El Niño (>1.5C Niño 3.4 sea surface temperature – SST – anomaly), but relatively few expect a “super El Niño” (>2.5C) as the world saw in 2015/2016 or 1997/1998.
Summer of extreme heat
Record-setting global temperatures in June and July to date have been accompanied by record heat waves in many regions. Italy’s Rome shattered its highest temperature record (set only last year in 2022) by 2C on 18 July, seeing 42.9C (109F).
Parts of the US have been baking under record-setting persistent heat, with Phoenix in Arizona seeing 19 days in a row over 43C (110F). China also set a provisional new national temperature record of 52.2C (126F).
The extreme heat in 2023 likely contributed to wildfires in places such as Canada, Turkey and Croatia. In Canada, fires have burned a record 25 million acres so far in 2023, an area larger than the country of Portugal. There was also extreme flooding, with more than 100 people killed in deluges in India and at least a dozen people killed in floods in South Korea.
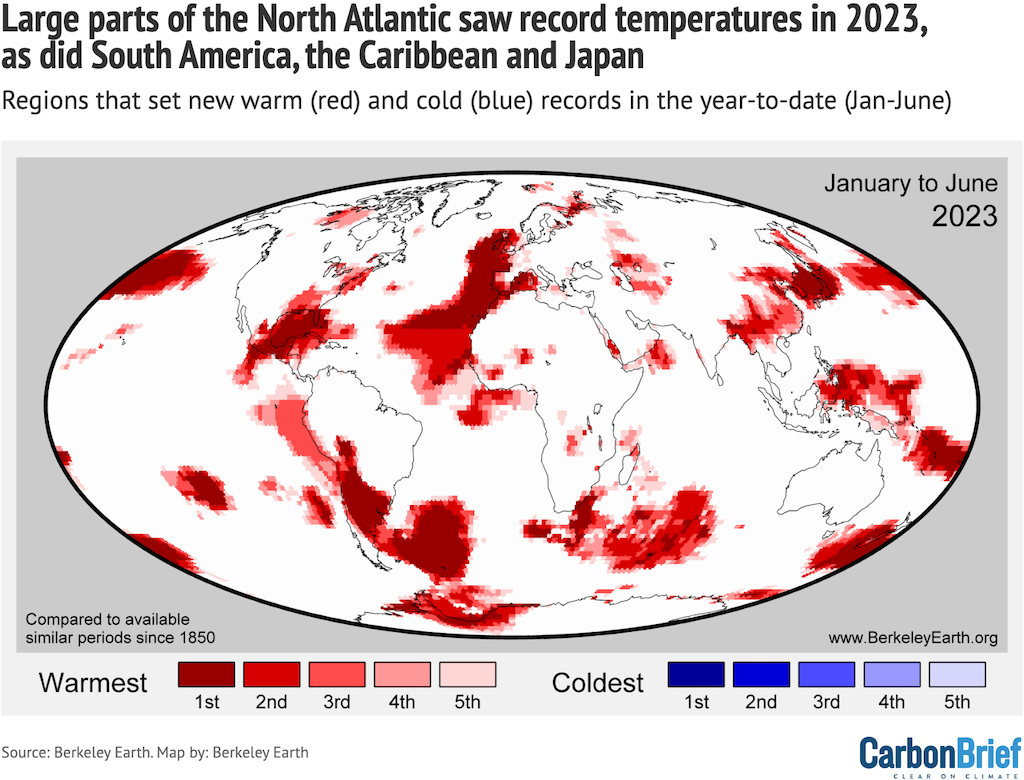
The figure below shows the parts of the world that saw record warm or cold temperatures over the first half of 2023 (January through June) in the Berkeley Earth dataset.
Notably, no area on Earth saw record cold (or even the 2nd-5th coldest temperatures on record). Large parts of the North Atlantic saw record warm temperatures, as did South America, the Caribbean and Japan.
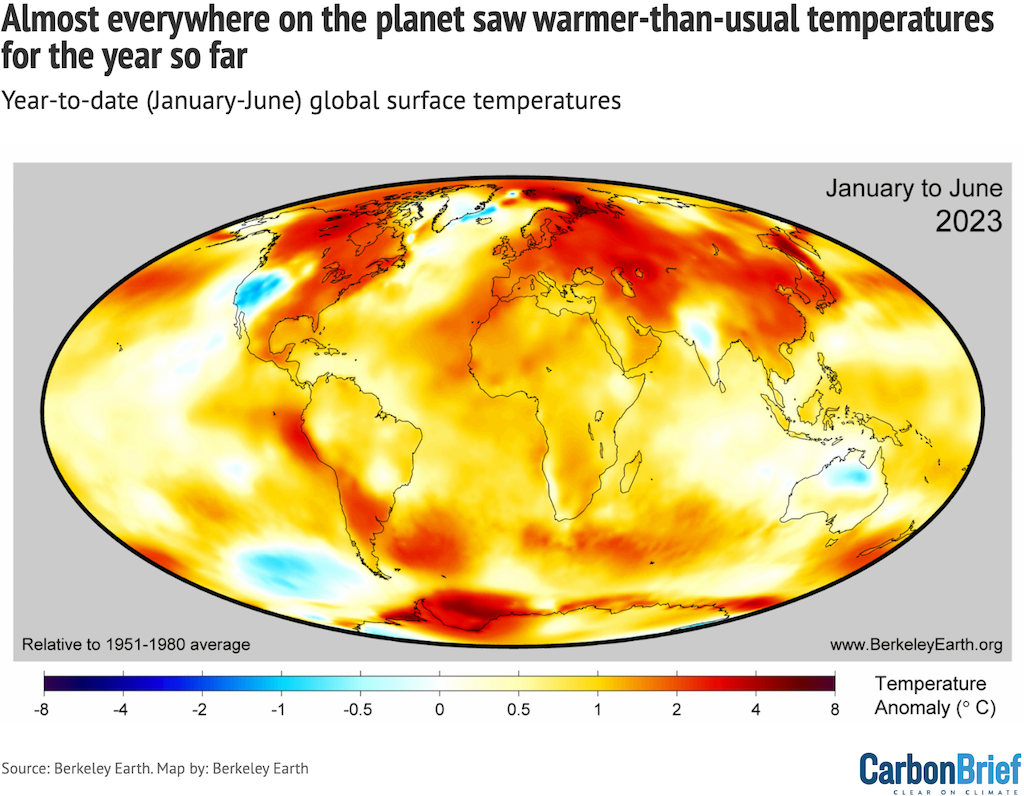
Almost everywhere on the planet saw warmer-than-usual temperatures for the year so far, with the exception of the Western US, India and Australia.
The tropical Pacific has had relatively neutral temperatures for the first half of the year, with the early-year La Niña conditions balancing out the El Niño heat of recent months. The global temperature anomalies (changes) relative to the 1951-80 period are shown in the map below.
Record daily temperatures in July
While global temperature records are not yet in for the full month of July 2023, real-time reanalysis products increasingly allow scientists to track global temperatures on a daily basis.
Reanalysis ingests a huge amount of data from satellites, weather balloons, aeroplanes, weather stations, ships, and buoys among others to provide a detailed look at how the Earth’s climate is changing in real-time.
These have shown particularly extreme global temperatures in the month of July, resulting in global media coverage of the hottest days on record globally.
Much of this was based on NOAA’s NCEP CFSv2 reanalysis product used by the University of Maine Climate Reanalyzer tool. However, this is an older reanalysis product that suffers from some challenges in accurately assessing changing temperatures over time as the types of input data have changed.
Modern reanalysis products, such as JRA-55 and ERA5, use state-of-the-art methods to produce more accurate records.
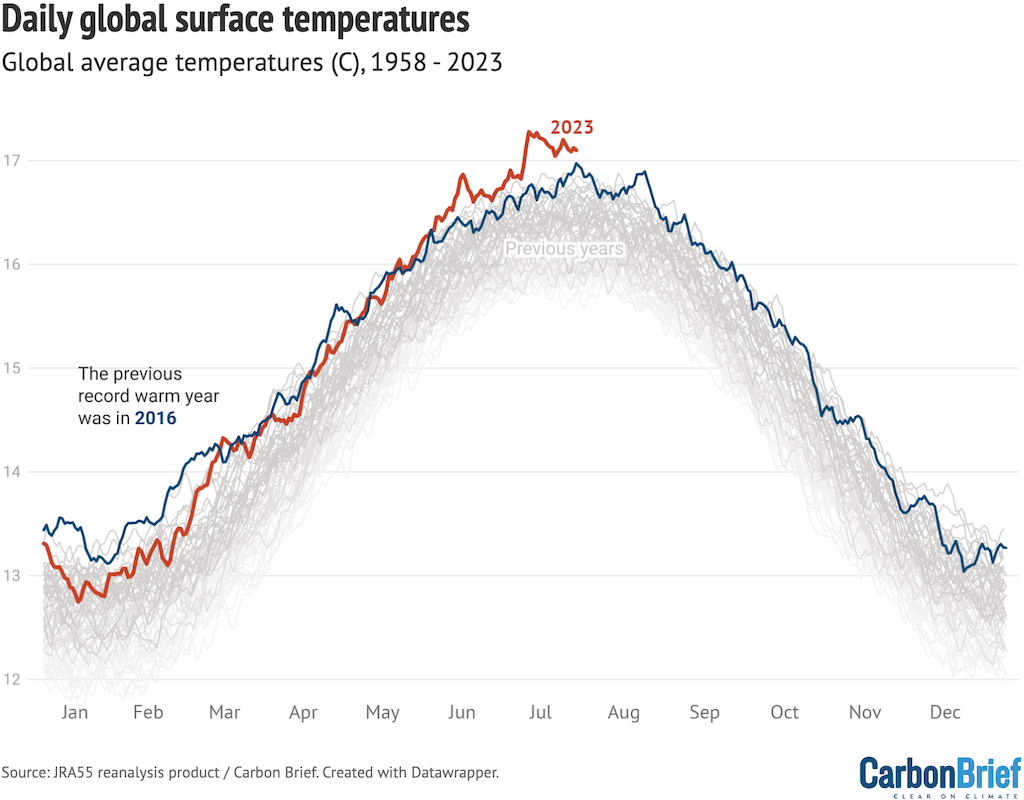
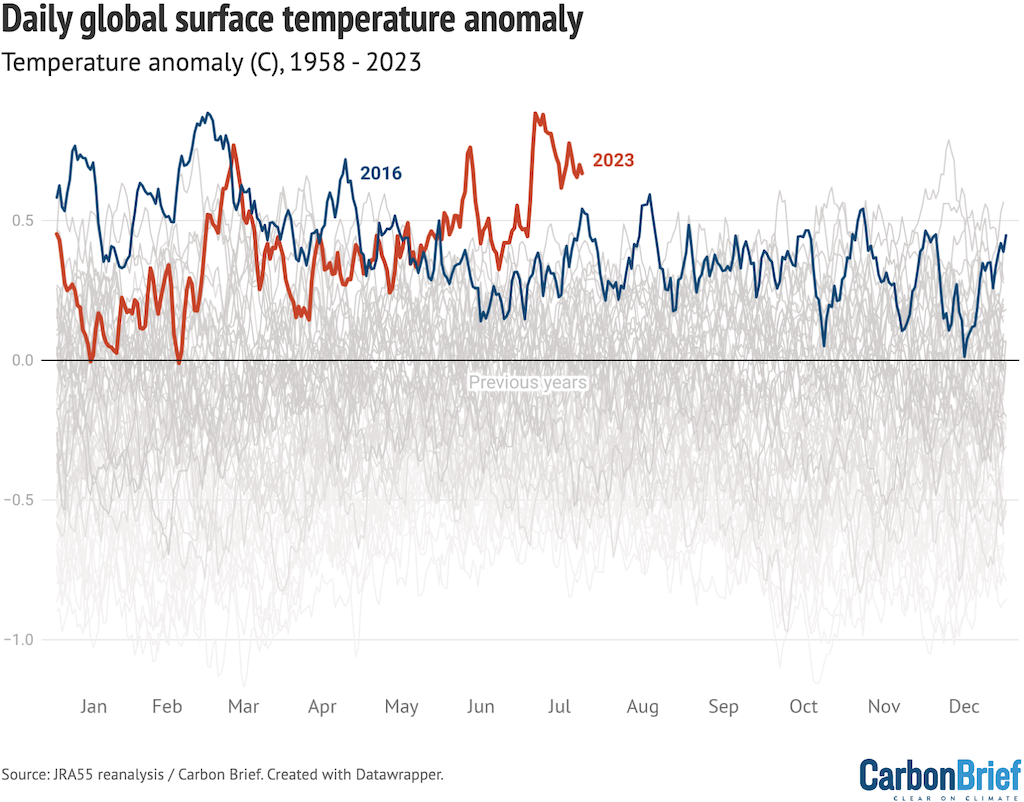
In the figure below, Carbon Brief shows the daily global temperature values from the JRA-55 reanalysis product for each day since the record began in 1958 (grey lines). It shows the current year to date (2023) in red and the prior record warm year, 2016, in blue. The days since July 3rd (the 184th day of the year) have been warmer than any prior days since the JRA-55 record began in 1958 – and, potentially, further into the past.
It is also possible to look at these temperatures as anomalies – the departure from a long-term average – rather than absolute temperatures.
The figure below shows how 2023 has started off well below the prior record year (2016), but has exceeded it consistently since the beginning of June.
In addition to global surface temperatures, the oceans have been unusually warm in the past few months. The figure below shows the global daily sea surface temperature anomalies across the world’s oceans between 60S and 60N, with an unprecedented spike over the past few months of 2023.
Finally, with the majority of days in for the month of July, it can be estimated where July global temperatures will end up in the various reanalysis datasets.
The figure below shows Carbon Brief’s analysis of historical July data from three reanalysis products with daily global temperature values: ERA5; JRA-55; and NCEP CFSv2. The predicted July 2023 values is shown, along with its uncertainty given the number of remaining days.
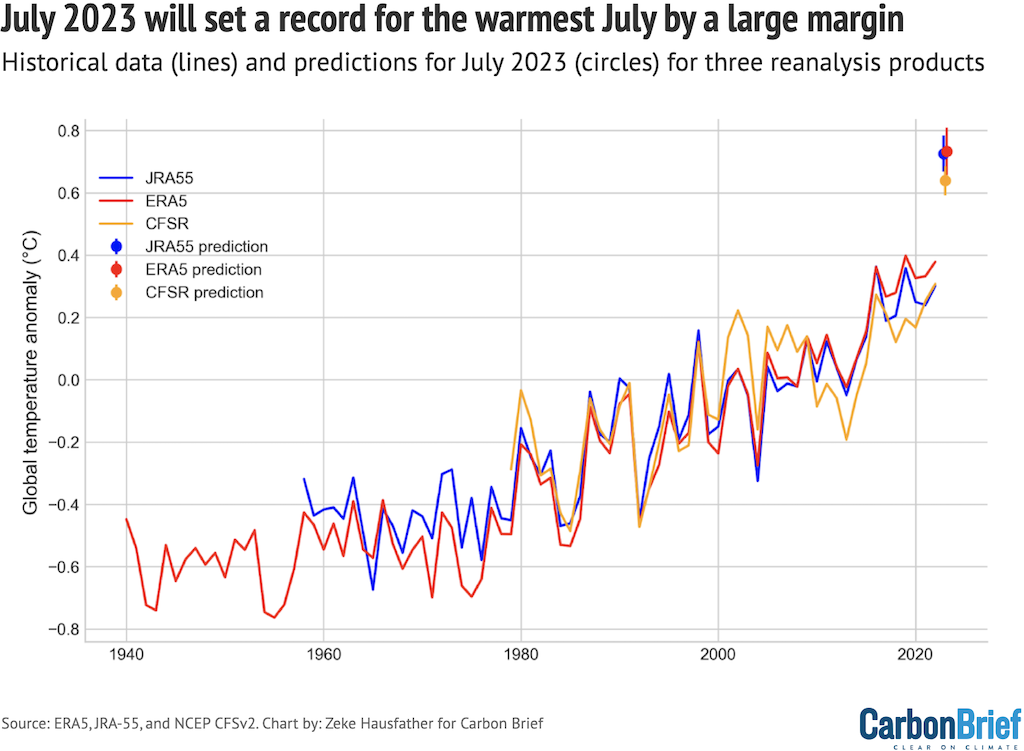
It is clear that July 2023 will set a new record for the warmest July by an extremely large margin, around 0.3C, reflecting the combination of human-driven warming, a growing El Niño event, plus other factors such as stratospheric water vapour from the 2022 eruption of the Hunga Tonga-Hunga Ha’apai volcano and a phase-out of sulphur in marine shipping fuels.
On track to be warmest year on record
Using the data from the first six months of the year, plus both past and forecast future ENSO conditions, Carbon Brief has predicted where 2023 temperatures will likely land for each different surface temperature record.
The results are shown in the table below, with the probability of the year ending up as the first-to-fourth warmest on record shown for each dataset. (There is virtually no chance that 2023 will end up below the fourth warmest.)
In all datasets except Copernicus, 2023 is more likely than not (e.g. >50% chance) to end up as the warmest year on record. (Copernicus still sees a 1st place outcome as more likely than any other, but there is still a ~53% chance it will not be the warmest.)
| GISTEMP | HadCRUT5 | NOAA | Berkeley | Copernicus | |
|---|---|---|---|---|---|
| 1st | 62% | 79% | 58% | 76% | 47% |
| 2nd | 1% | 7% | 18% | 7% | 6% |
| 3rd | 27% | 11% | 18% | 11% | 26% |
| 4th | 9% | 3% | 5% | 5% | 19% |
Estimated probabilities of where 2023 will rank compared to previous years for each global temperature dataset, with the highest probability outcome in bold. Note that these probabilities do not include measurement uncertainty for each record, just the central estimate.
Due to the fact that only half a year of data is available so far, there is still a fair amount of uncertainty around where temperatures will end up. The figure below shows the projected 2023 temperatures in the Berkeley Earth dataset, with both the year-to-date and the range of likely 2023 annual temperatures shown.
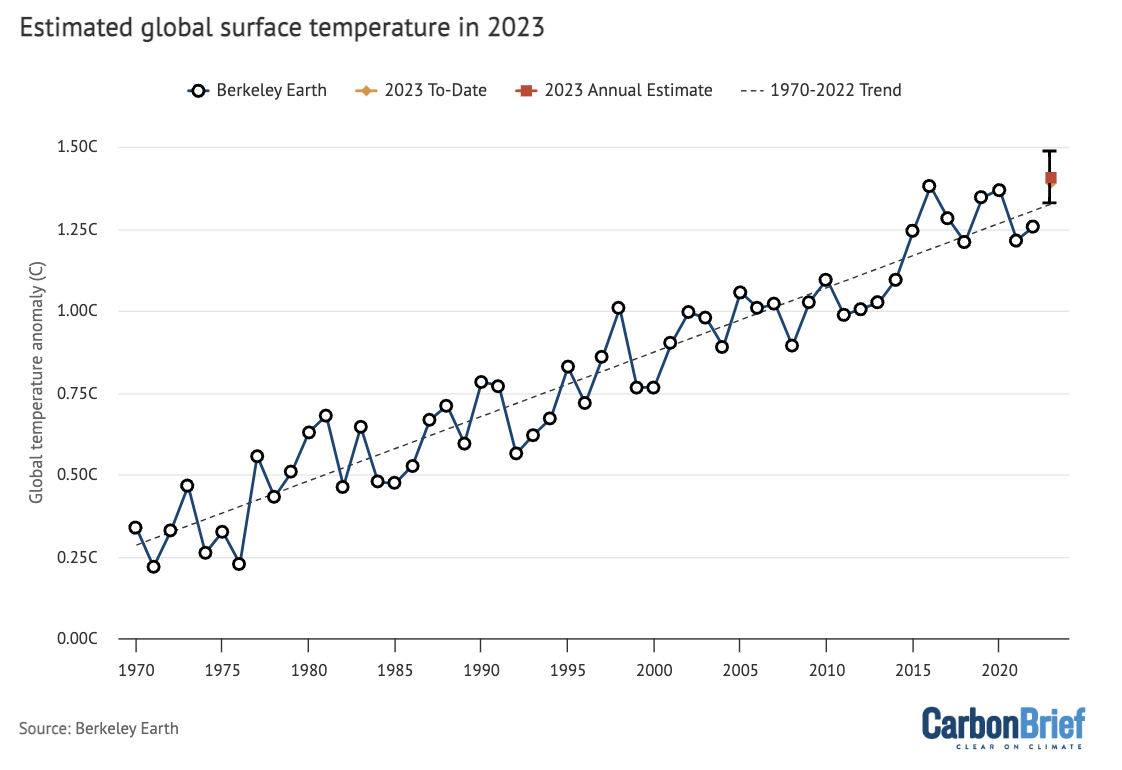
Annual global temperatures (circles) and long term trend (dashed line) for the Berkeley Earth series from 1970-2022. Squares show the annual (red) and year-to-date (yellow) estimate for 2023. See the methodological note at the end of the article for details. Chart by Zeke Hausfather for Carbon Brief using Highcharts.
The odds of 2023 being a record year shown above are likely conservative, as they are based on monthly data between January and June and do not include the extremely warm July temperatures seen in daily reanalysis products. The planet is also likely to experience an extremely warm 2024, as the current El Niño event will influence temperatures well into next year.
Temperatures are tracking climate model projections
Climate models provide physics-based estimates of future warming given different assumptions about future emissions, greenhouse gas concentrations and other climate-influencing factors.
The figure below shows the range of individual models forecasts featured in the Intergovernmental Panel on Climate Change’s (IPCC) fifth assessment report – known collectively as the CMIP5 models – between 1970 and 2030, with grey shading and the average projection across all the models shown in black. Individual observational temperature records are represented by coloured lines.
In these models, estimates of temperatures prior to 2005 are a “hindcast” using known past climate influences, while temperatures projected after 2005 are a “forecast” based on an estimate of how things might change.
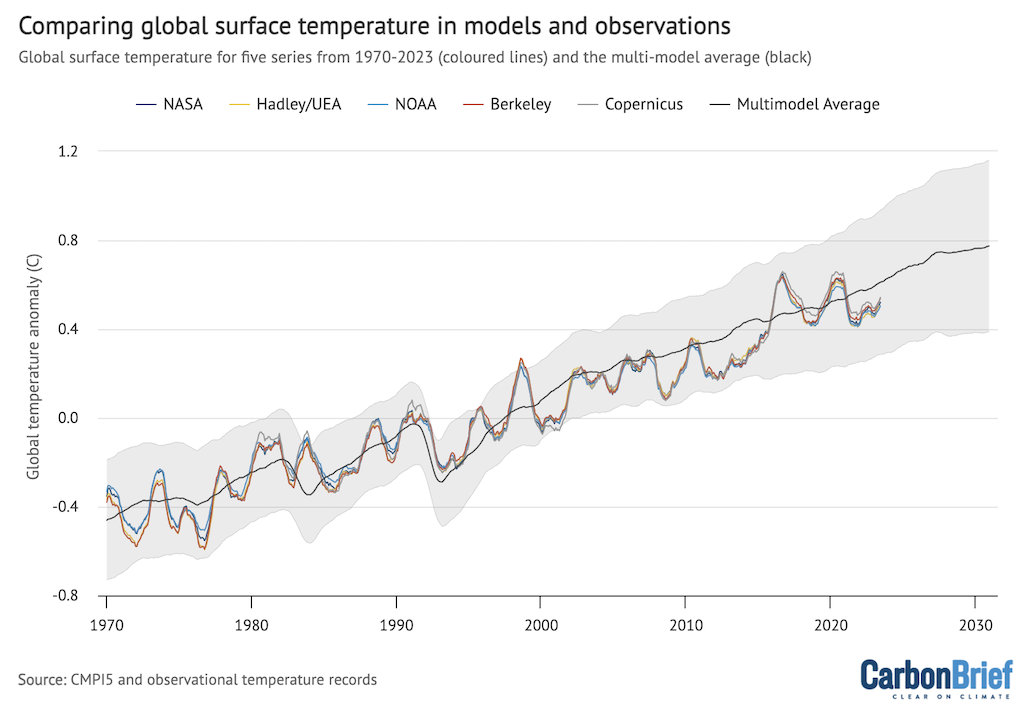
Twelve-month average global average surface temperatures from CMIP5 models and observations between 1970 and 2023. Models use RCP4.5 forcings after 2005. They include sea surface temperatures over oceans and surface air temperatures over land to match what is measured by observations. Anomalies plotted with respect to a 1981-2010 baseline. Chart by Zeke Hausfather for Carbon Brief using Highcharts.
While global temperatures were running below the pace of warming projected by climate models between 2005 and 2014, the past decade has been closer to the model average.
Record low Antarctic sea ice extent
Highly accurate observations of Arctic and Antarctic sea ice have been available since polar-observing satellites became available in the late 1970s.
Arctic sea ice extent during the first half of 2023 has been at the low end of the historical 1979-2010 range, but has not seen any record daily lows except for a few days in February and April.
Antarctic sea ice, on the other hand, has set new all-time low records for most of 2023, set a new all-time low extent in February 2023, and has been far below average for the past few months.
The figure below shows both Arctic (red) and Antarctic (blue) sea ice extent in 2023, the historical range in the record between 1979 and 2010 (shaded areas) and the record lows (dotted black line).
Unlike global temperature records (which only report monthly averages), sea ice data is collected and updated on a daily basis, allowing sea ice extent to be viewed through to the present day.
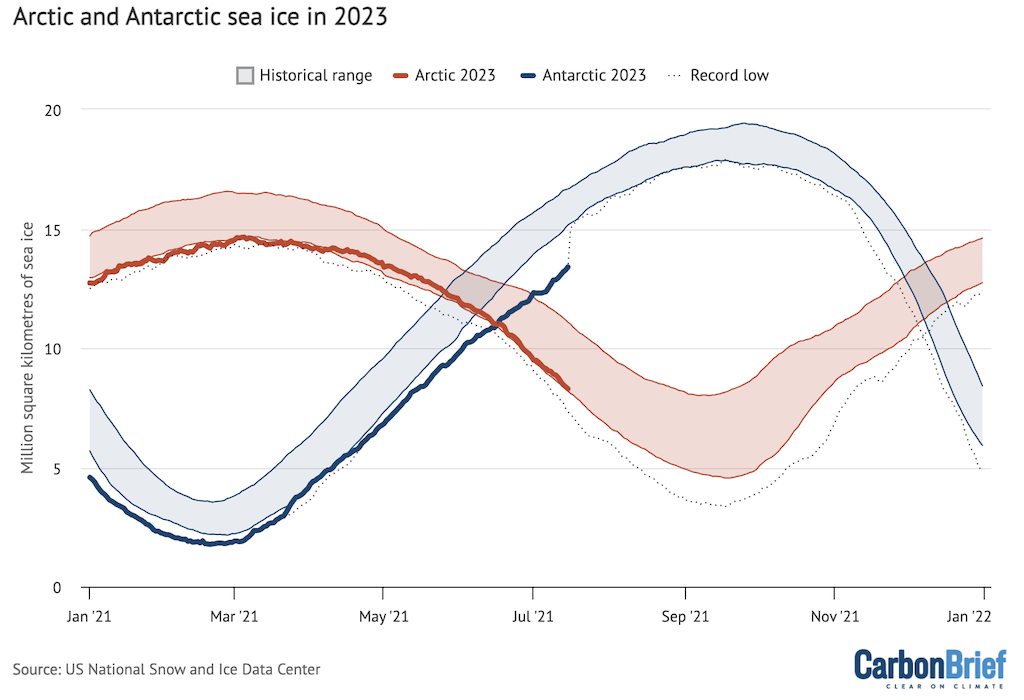
Arctic and Antarctic daily sea ice extent from the US National Snow and Ice Data Center. The bold lines show daily 2023 values, the shaded area indicates the two standard deviation range in historical values between 1979 and 2010. The dotted black lines show the record lows for each pole. Chart by Carbon Brief using Highcharts.
Antarctic sea ice extent has been extremely anomalous in 2023. The blue line representing 2023 has been diverging from previous years, most notably in recent months. Scientists are actively working to assess how different factors have affected record low Antarctic sea ice levels this year.
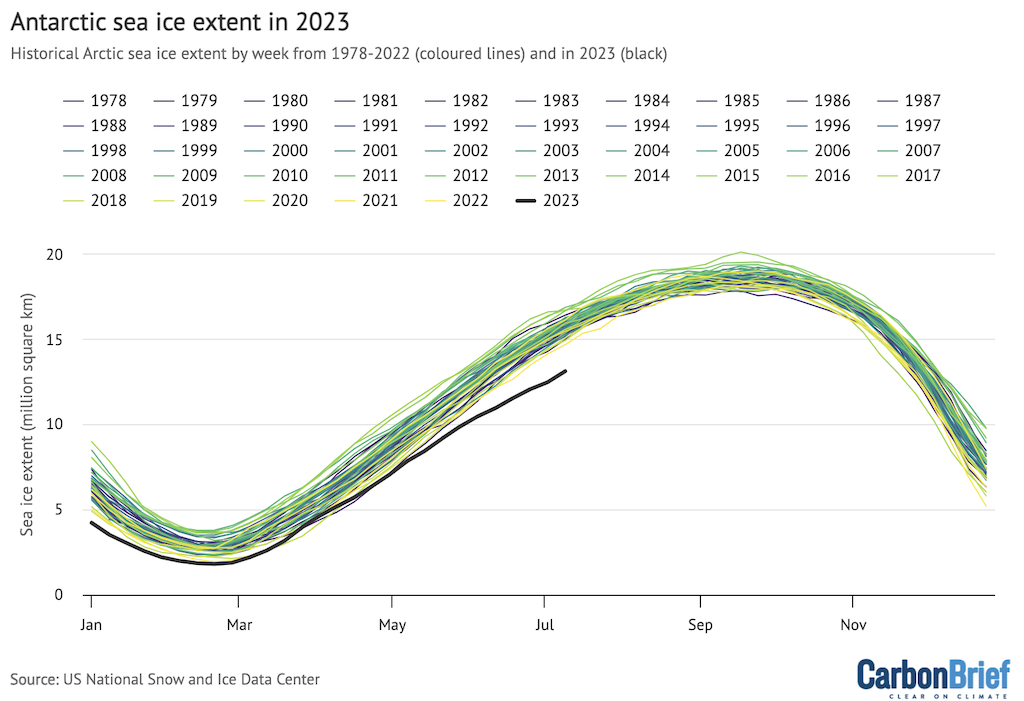
Weekly Antarctic sea ice extent from the US National Snow and Ice Data Center. Chart by Zeke Hausfather for Carbon Brief using Highcharts.
Methodological note
A statistical multivariate regression model was used to estimate the range of likely 2023 annual temperatures for each group that provides a temperature record. This model used the average temperature over the first six months of the year, the average ENSO 3.4 region value during the first six months of the year and the average predicted ENSO 3.4 value during the last six months of the year to estimate the annual temperatures.
The model was trained on the relationship between these variables and annual temperatures over the period from 1950-2022 (or 1979-2022 for the Copernicus/ECMWF dataset). The model then uses this fit to predict both the most likely 2023 annual value for each group, as well as the 95% confidence interval. The predicted ENSO 3.4 region values for the last six months of 2023 are taken from the IRI plume forecast.
The percent likelihood of different year ranks for 2023 is estimated by using the output of the regression model, assuming a normal distribution of results. This allows Carbon Brief to estimate what percent of possible 2023 annual values fall above and below the temperatures of prior years for each group.
Sharelines from this story


Discussion about this post