










ggplot2 is not only the R language’s most popular data visualization package, it is also an ecosystem. Numerous add-on packages give ggplot added power to do everything from more easily changing axis labels to auto-generating statistical information to customizing . . . almost anything.
Here are a dozen great ggplot2 extensions you should know.
Create your own geoms: ggpackets
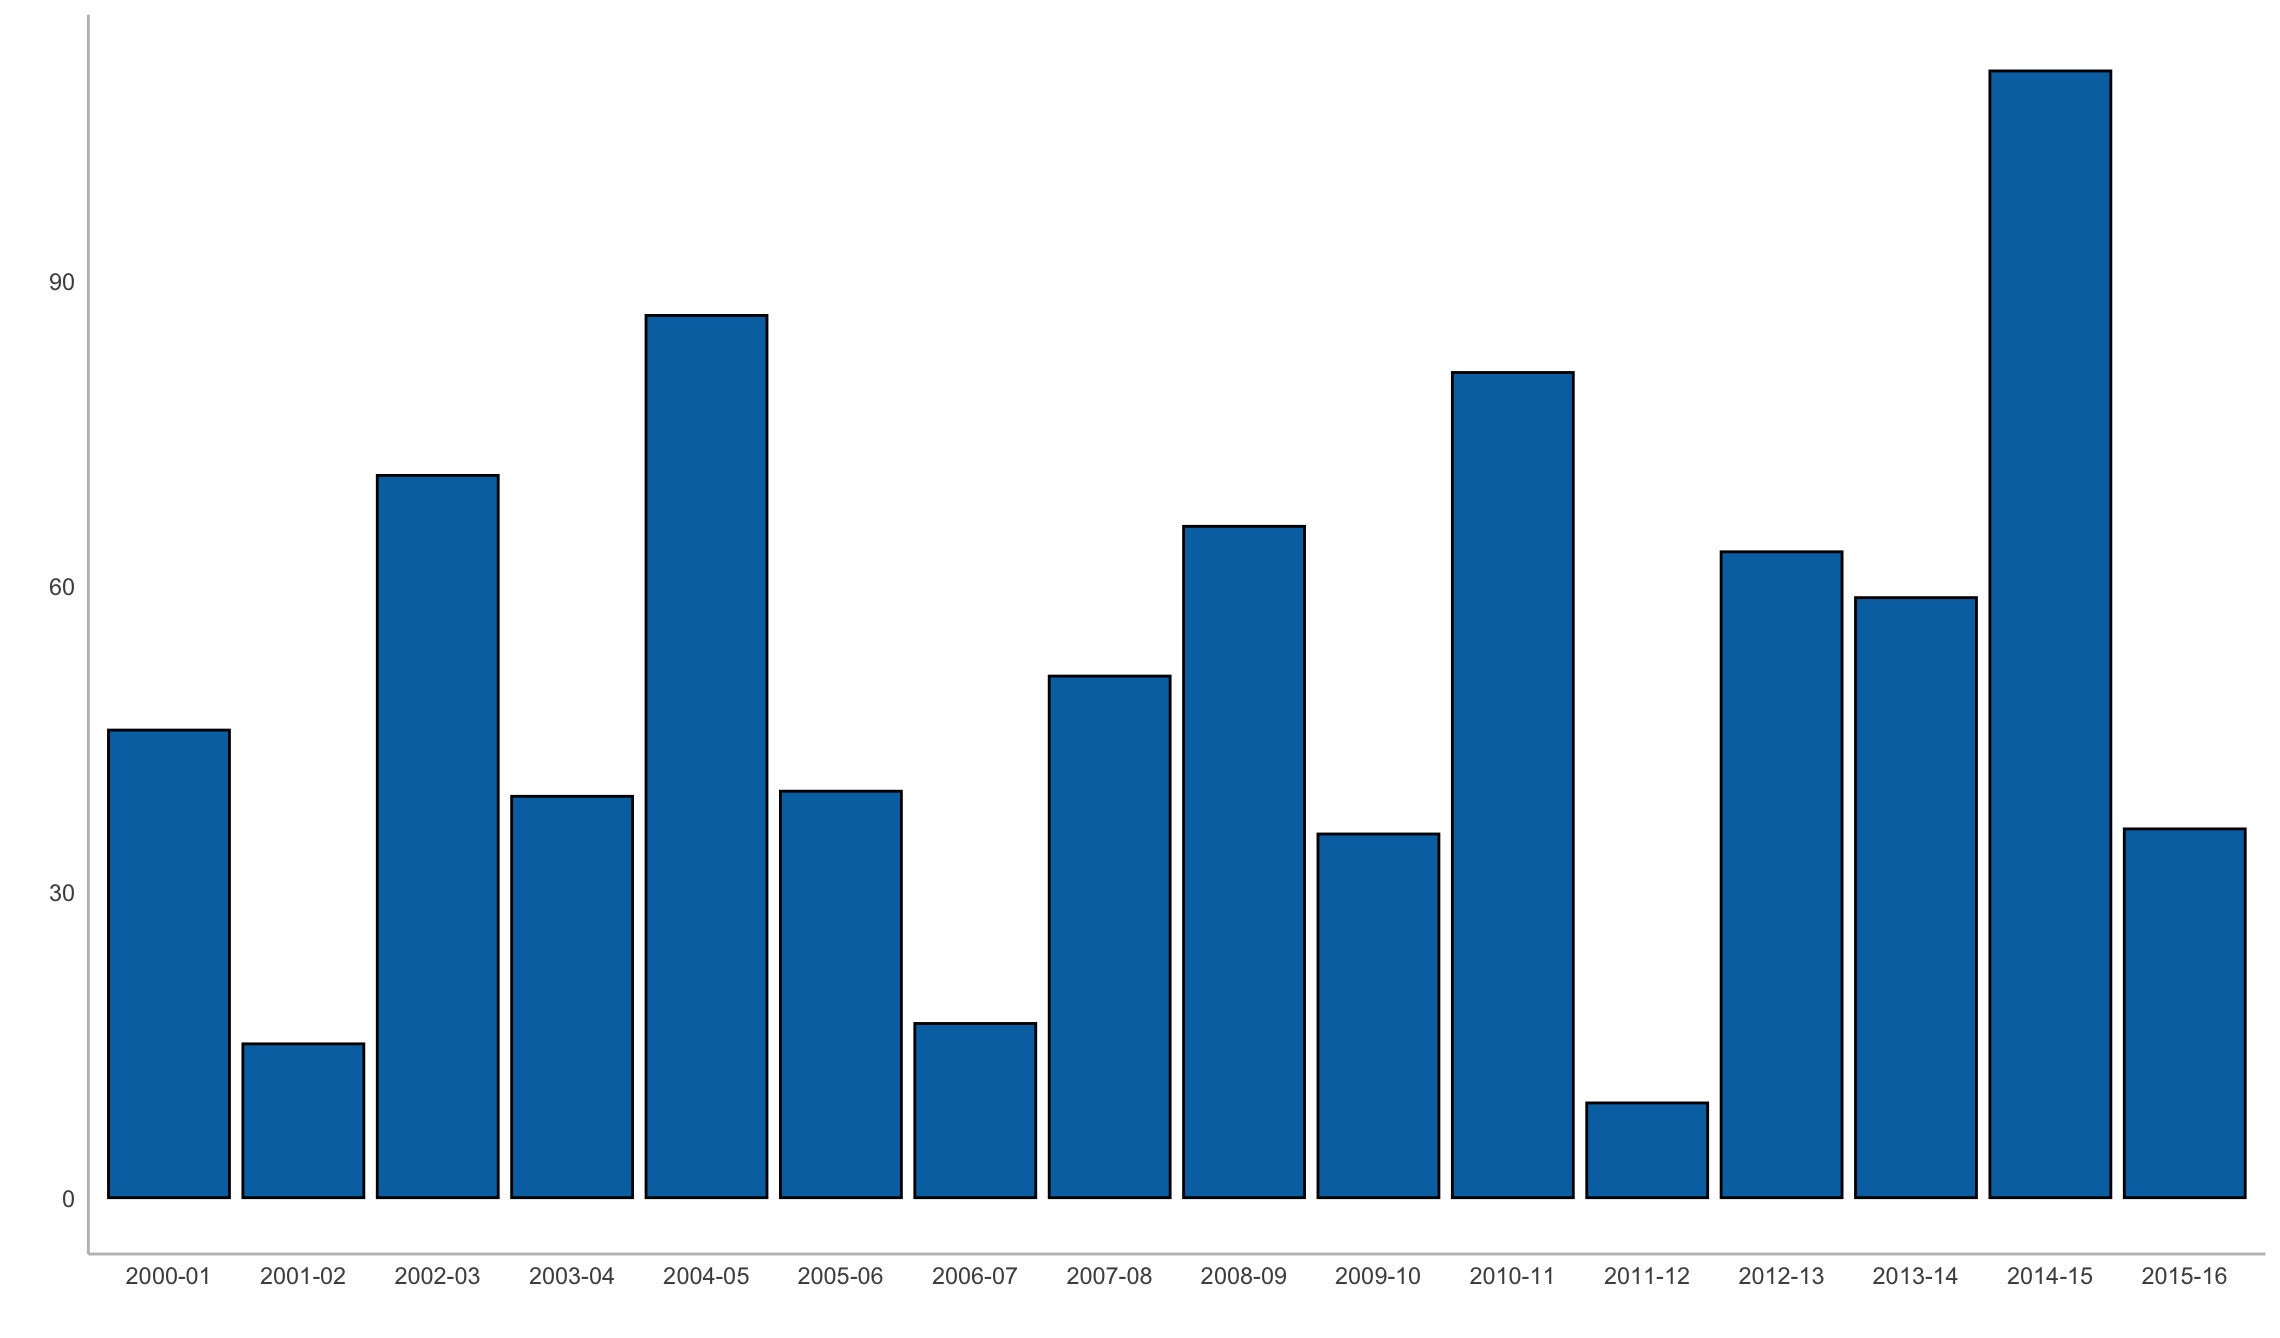
Once you’ve added multiple layers and tweaks to a ggplot graph, how can you save that work so it’s easy to re-use? One way is to convert your code into a function. Another is to turn it into an RStudio code snippet. But the ggpackets package has a ggplot-friendlier way: Create your own custom geom! It’s as painless as storing it in a variable using the ggpacket() function.
The example code below creates a bar chart from Boston snowfall data, and it has several lines of customizations that I’d like to use again with other data. The first code block is the initial graph:
library(ggplot2)
library(scales)
library(rio)
snowfall2000s <- import("https://gist.githubusercontent.com/smach/5544e1818a76a2cf95826b78a80fc7d5/raw/8fd7cfd8fa7b23cba5c13520f5f06580f4d9241c/boston_snowfall.2000s.csv")
ggplot(snowfall2000s, aes(x = Winter, y = Total)) +
  geom_col(color = "black", fill="#0072B2") +
  theme_minimal() +
  theme(panel.border = element_blank(), panel.grid.major = element_blank(),
        panel.grid.minor = element_blank(), axis.line =
          element_line(colour = "gray"),
        plot.title = element_text(hjust = 0.5),
        plot.subtitle = element_text(hjust = 0.5)
  ) +
  ylab("") + xlab("")
Here’s how to turn that into a custom geom called my_geom_col:
library(ggpackets)
my_geom_col <- ggpacket() +
  geom_col(color = "black", fill="#0072B2") +
  theme_minimal() +
  theme(panel.border = element_blank(), panel.grid.major = element_blank(),
        panel.grid.minor = element_blank(), axis.line =
          element_line(colour = "gray"),
        plot.title = element_text(hjust = 0.5),
        plot.subtitle = element_text(hjust = 0.5)
  ) +
  ylab("") + xlab("")
Note that I saved everything except the original graph’s first ggplot() line of code to the custom geom.
Here’s how simple it is to use that new geom:
ggplot(snowfall2000s, aes(x = Winter, y = Total)) +
  my_geom_col()
 Sharon Machlis
Graph created with a custom ggpackets geom.
ggpackets is by Doug Kelkhoff and is available on CRAN.
Easier ggplot2 code: ggblanket and others
ggplot2 is incredibly powerful and customizable, but sometimes that comes at a cost of complexity. Several packages aim to streamline ggplot2 so common data visualizations are either simpler or more intuitive.
If you tend to forget which geoms to use for what, I recommend giving ggblanket a try. One of my favorite things about the package is that it merges col and fill aesthetics into a single col aesthetic, so I no longer need to remember whether to use a scale_fill_ or scale_colour_ function.
Another ggblanket benefit: Its geoms such as gg_col() or gg_point() include customization options within the functions themselves instead of requiring separate layers. And that means I only need to look at one help file to see things like pal is for defining a color palette and y_title sets the y-axis title, instead of searching help files for multiple separate functions. ggblanket may not make it easier for me to remember all those options, but they are easier to find.
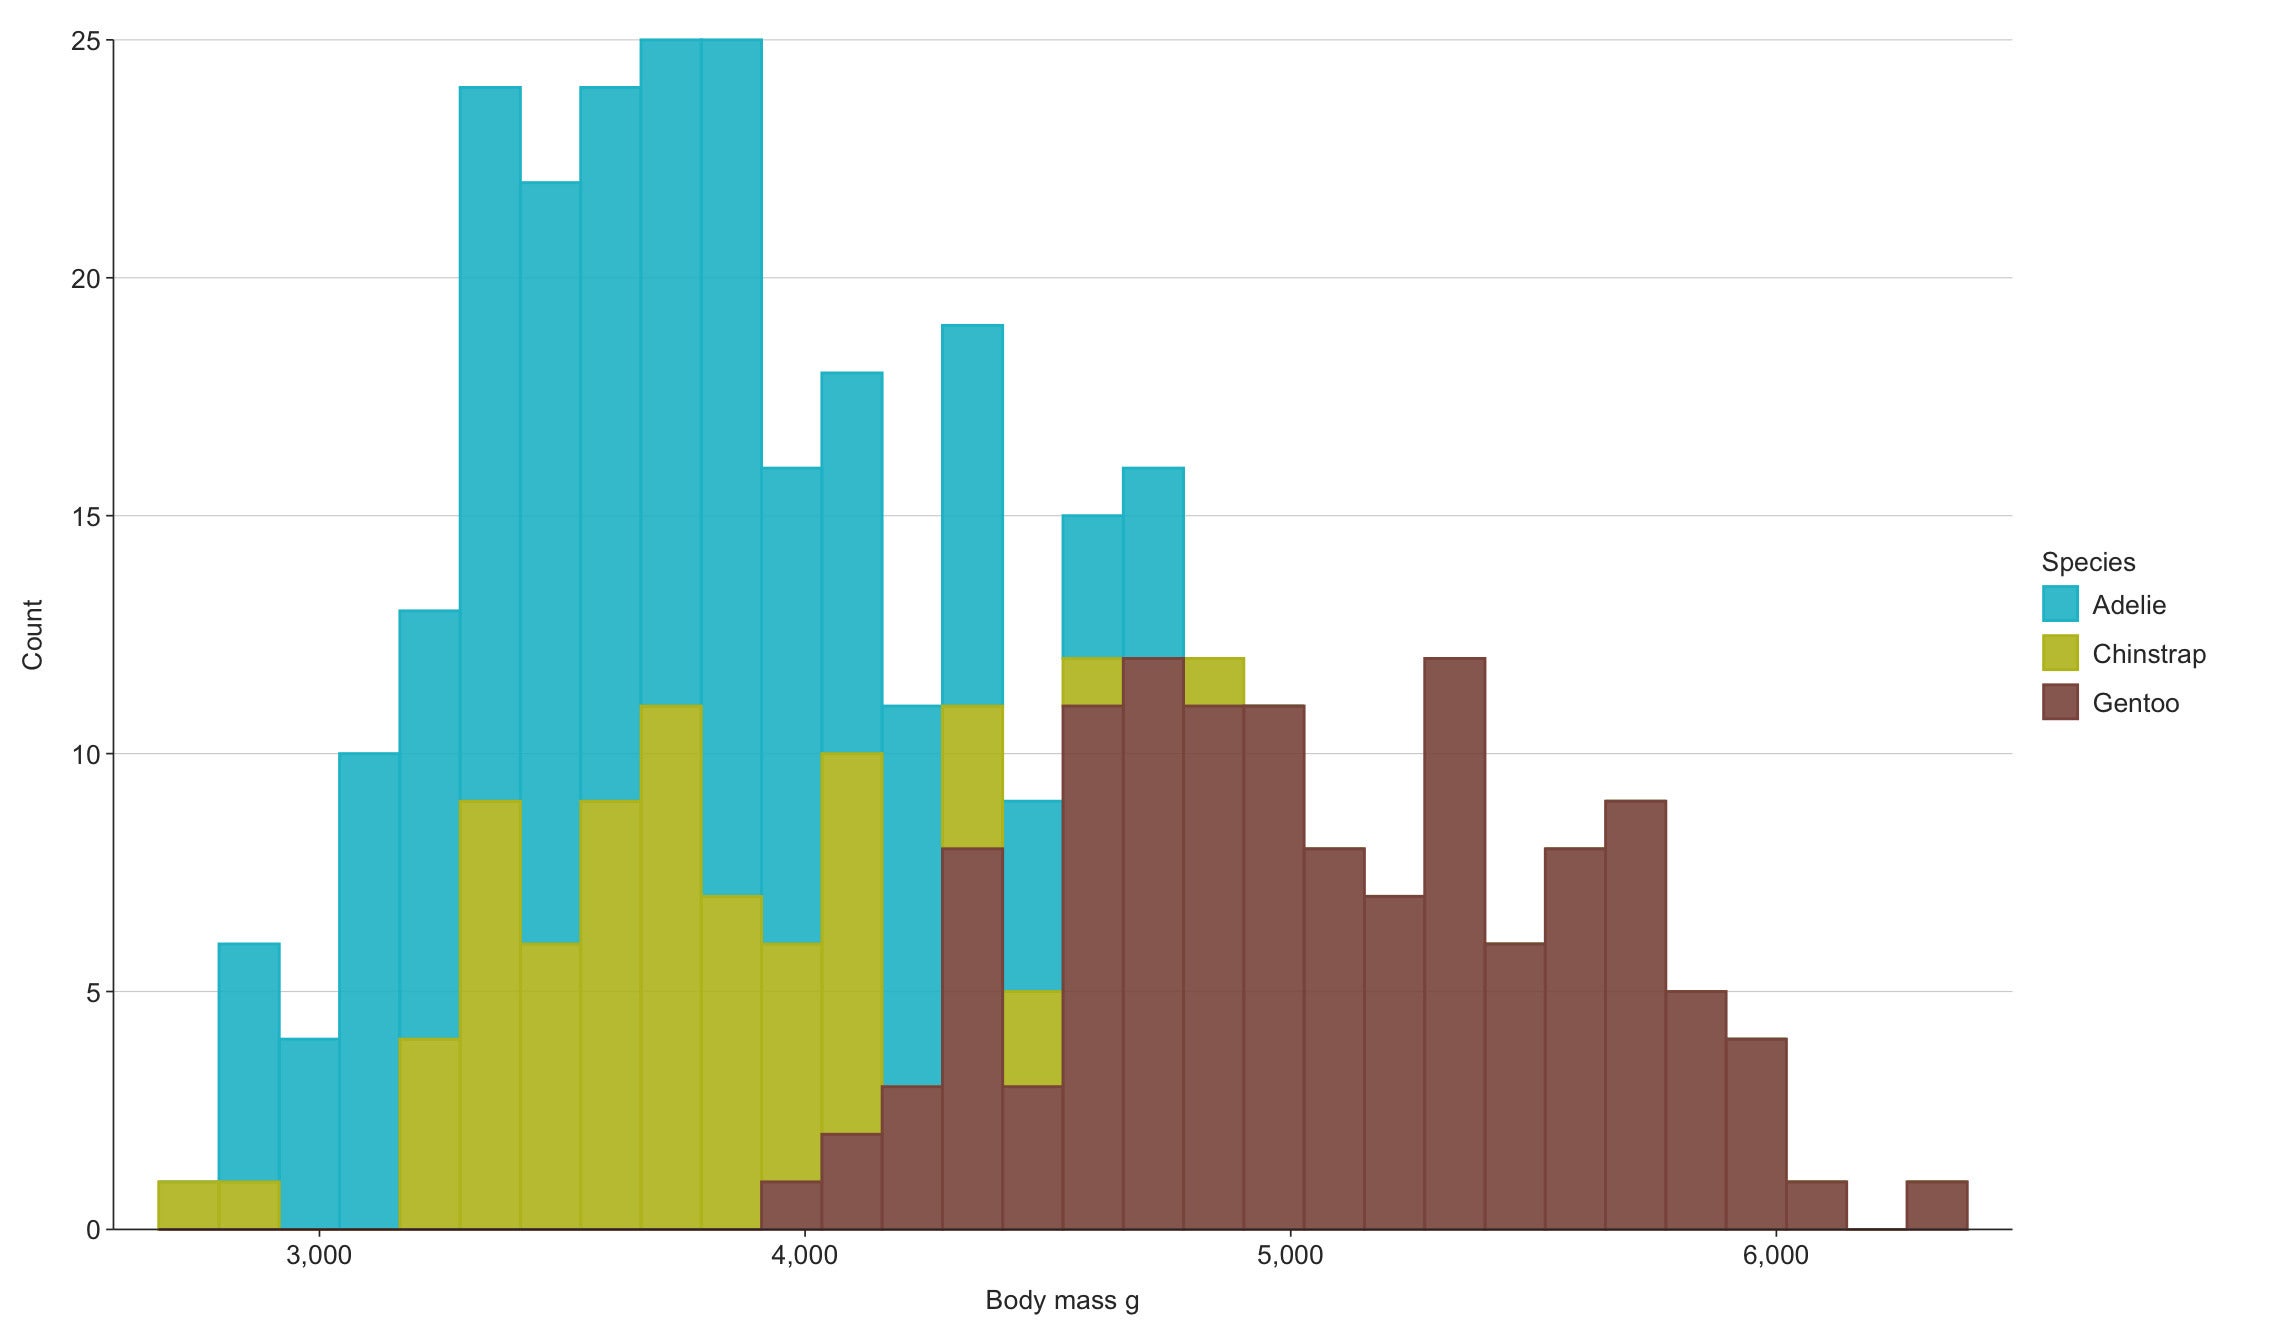
Here’s how to generate a histogram from the Palmer penguins data set with ggblanket, (example taken from the package website):
library(ggblanket)
library(palmerpenguins)
penguins |>
  gg_histogram(x = body_mass_g, col = species)
 Sharon Machlis
Histogram created with ggblanket.
The result is still a ggplot object, which means you can continue customizing it by adding layers with conventional ggplot2 code.
ggblanket is by David Hodge and is available on CRAN.
Several other packages try to simplify ggplot2 and change its defaults, too, including ggcharts. Its simplified functions use syntax like
library(ggcharts)
column_chart(snowfall2000s, x = Winter, y = Total)
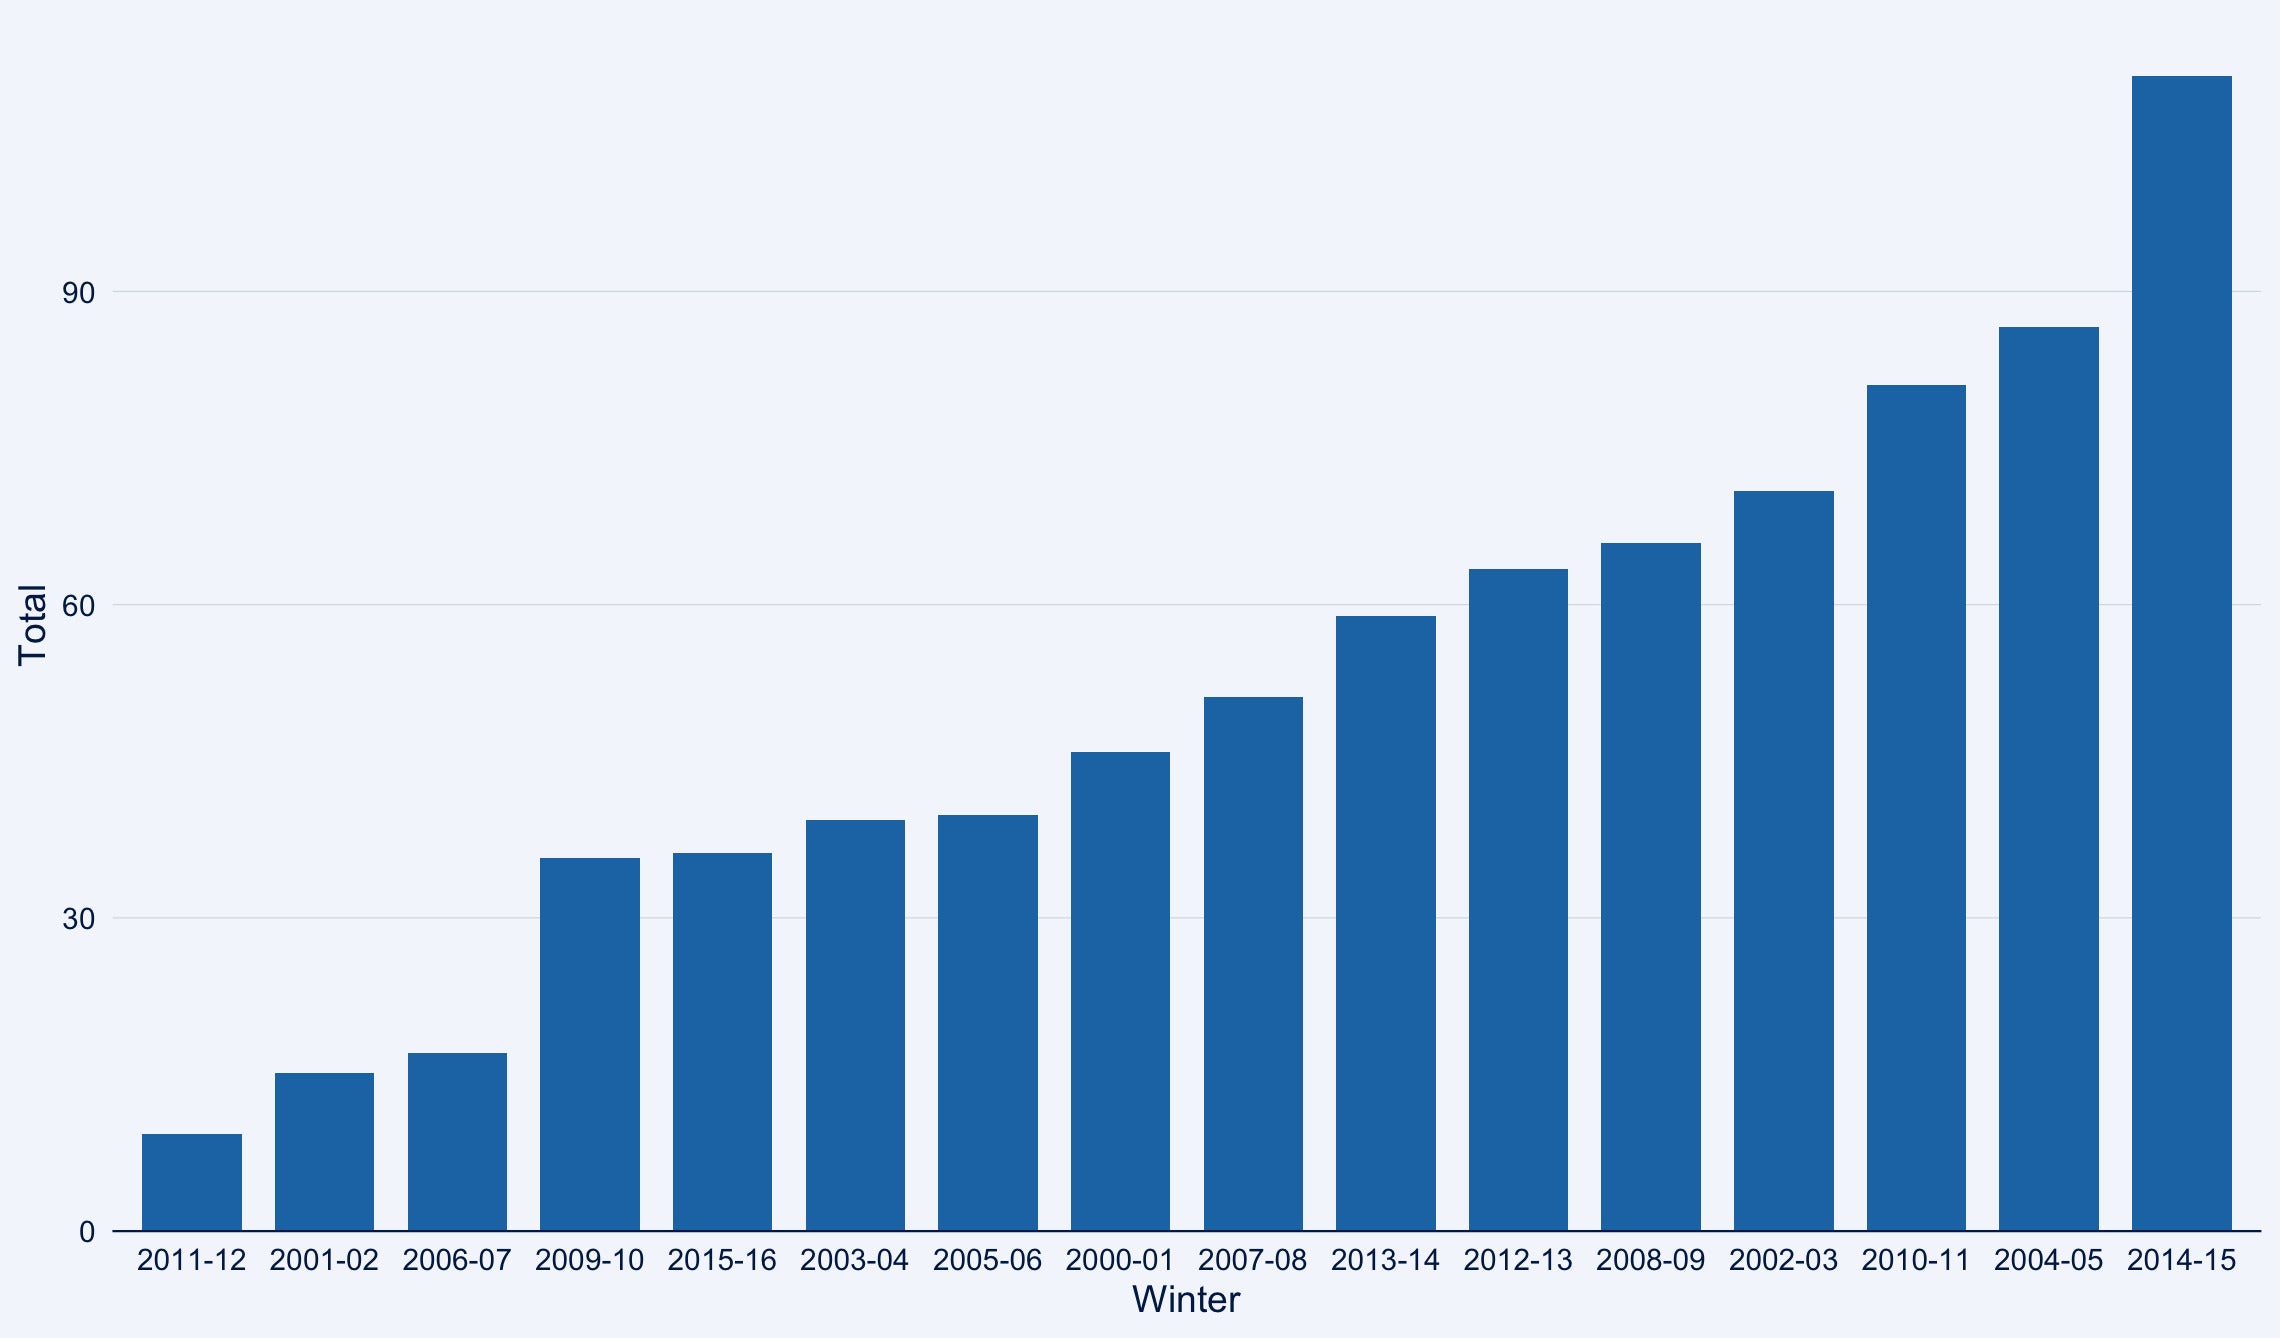
That single line of code provides a pretty decent default, plus automatically sorted bars (you can easily override that).
 Sharon Machlis
Bar chart created with ggcharts automatically sorts the bars by values.
See the InfoWorld ggcharts tutorial or the video below for more details.
Simple text customization: ggeasy
ggeasy doesn’t affect the “main” part of your dataviz—that is, the bar/point/line sizes, colors, orders, and so on. Instead, it’s all about customizing the text around the plots, such as labels and axis formatting. All ggeasy functions start with easy_ so it’s, yes, easy to find them using RStudio auto-complete.
Need to center a plot title? easy_center_title(). Want to rotate x-axis labels 90 degrees? easy_rotate_labels(which = "x").
Learn more about the package in the InfoWorld ggeasy tutorial or the video below.
ggeasy is by Jonathan Carroll and others and is available on CRAN.
Highlight items in your plots: gghighlight
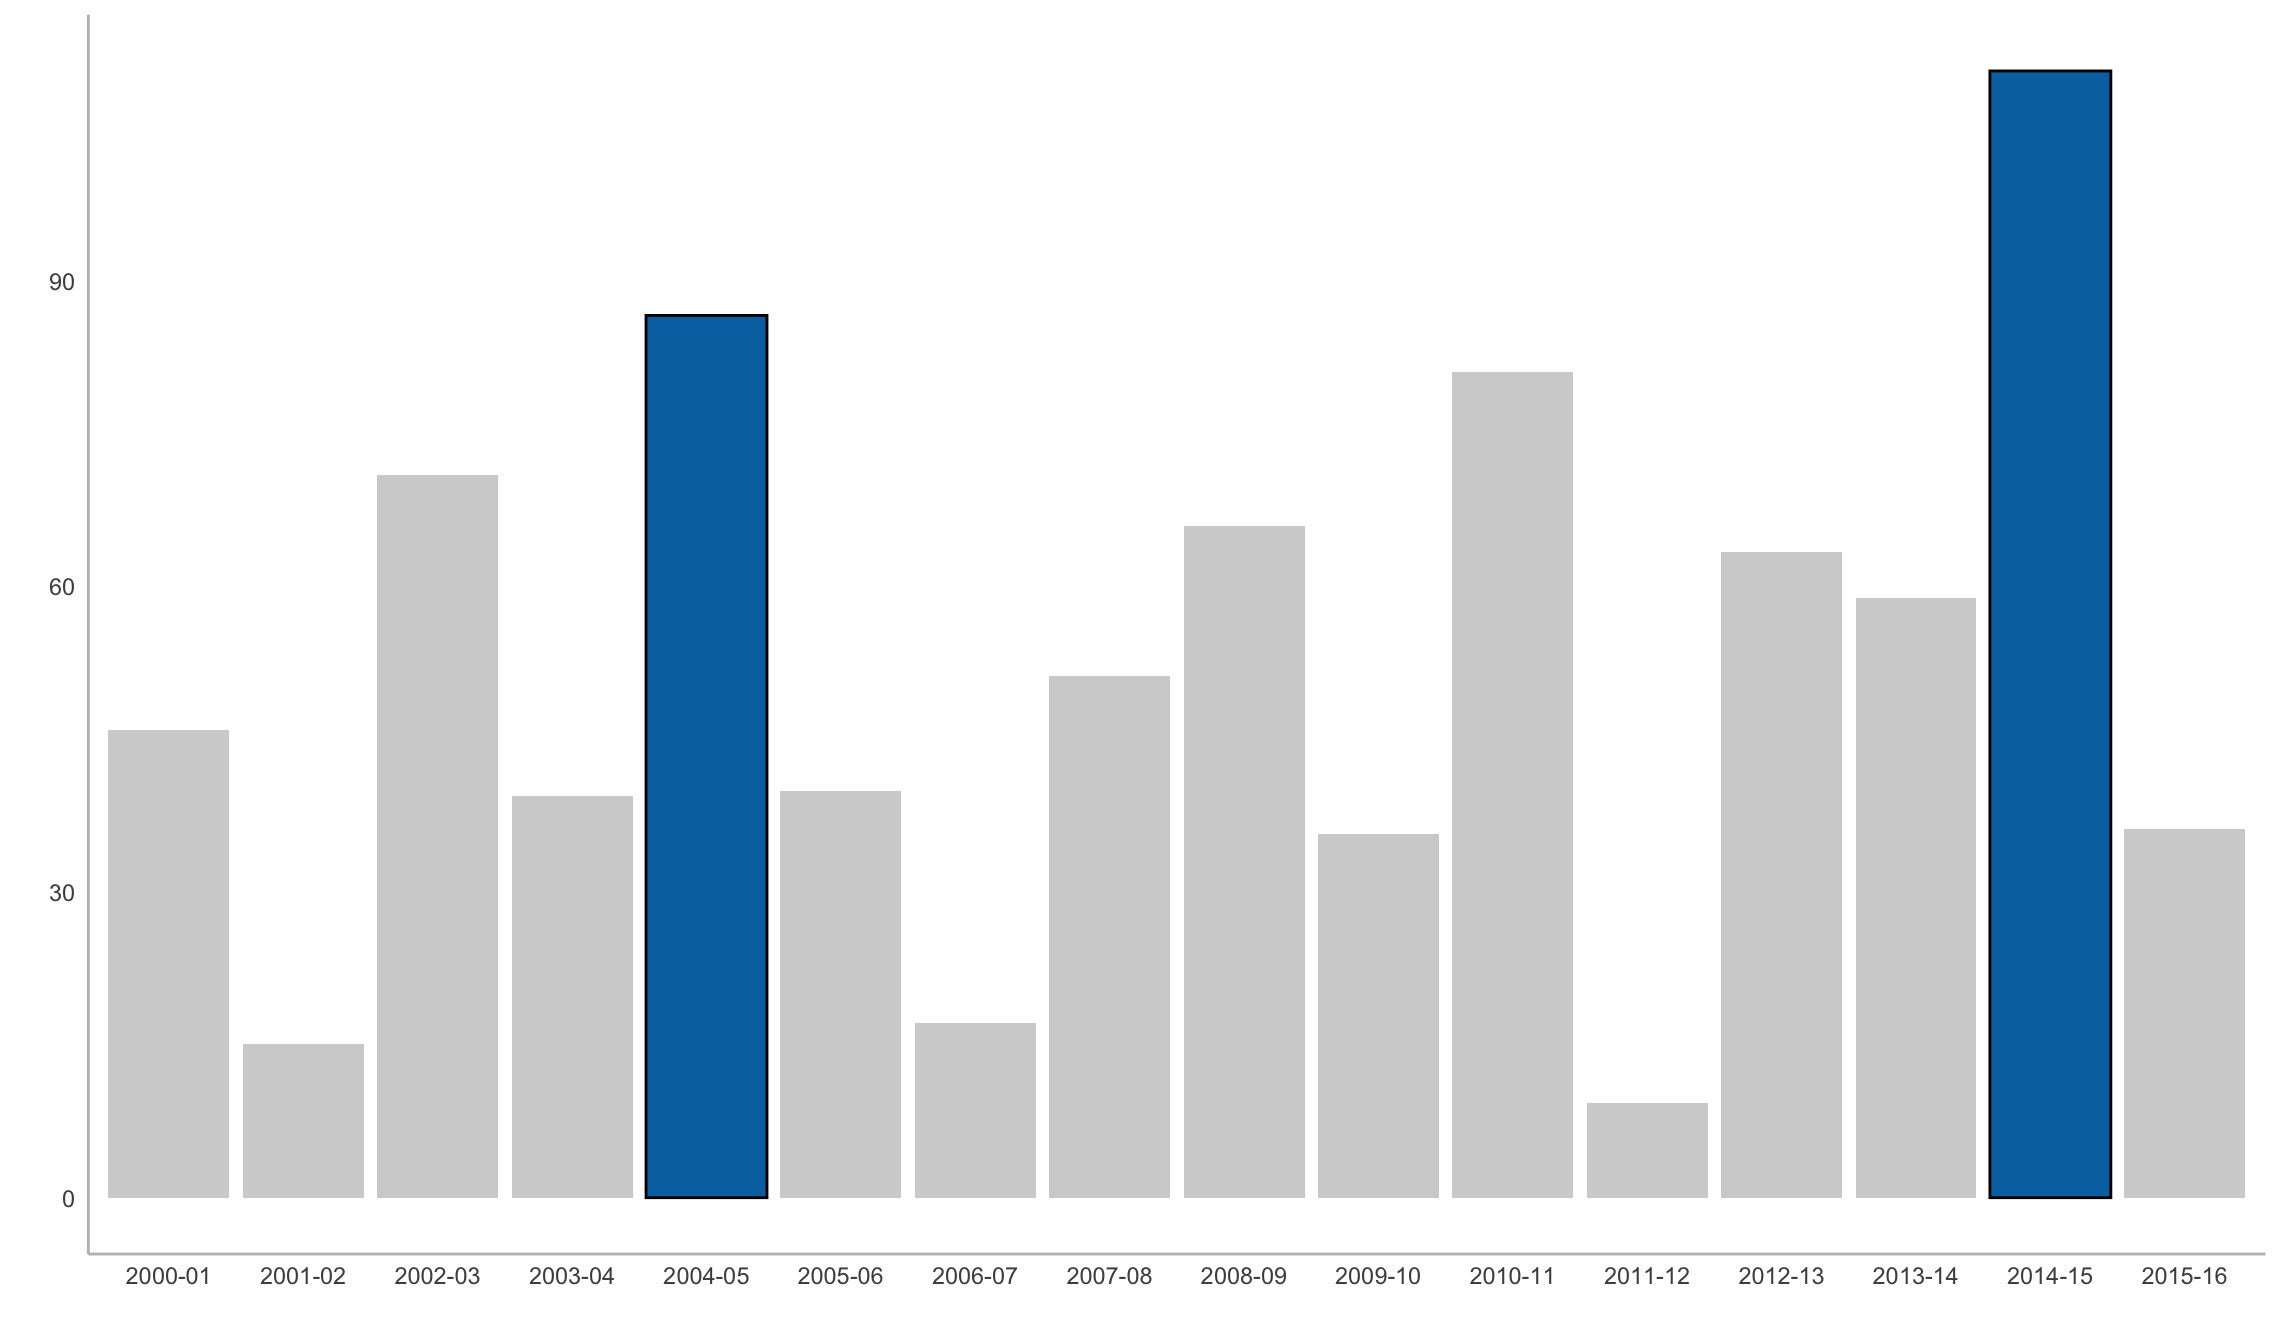
Sometimes you want to call attention to specific data points in a graph. You can certainly do that with ggplot alone, but gghighlight aims to make it easier. Just add the gghighlight() function along with a condition. For example, if winters with total snowfall higher than 85 inches are important to the story I’m telling, I could use gghighlight(Total > 85):
library(gghighlight)
ggplot(snowfall2000s, aes(x = Winter, y = Total)) +
  my_geom_col() +
  gghighlight(Total > 85)
 Sharon Machlis
Graph with totals over 85 highlighted using gghighliight.
Or if I want to call out specific years, such as 2011-12 and 2014-15, I can set those as my gghighlight() condition:
ggplot(snowfall2000s, aes(x = Winter, y = Total)) +
  my_geom_col() +
  gghighlight(Winter %in% c('2011-12', '2014-15'))
gghighlight is by Hiroaki Yutani and is available on CRAN.
Add themes or color palettes: ggthemes and others
The ggplot2 ecosystem includes a number of packages to add themes and color palettes. You likely won’t need them all, but you may want to browse through them to find ones that have themes or palettes you find compelling.
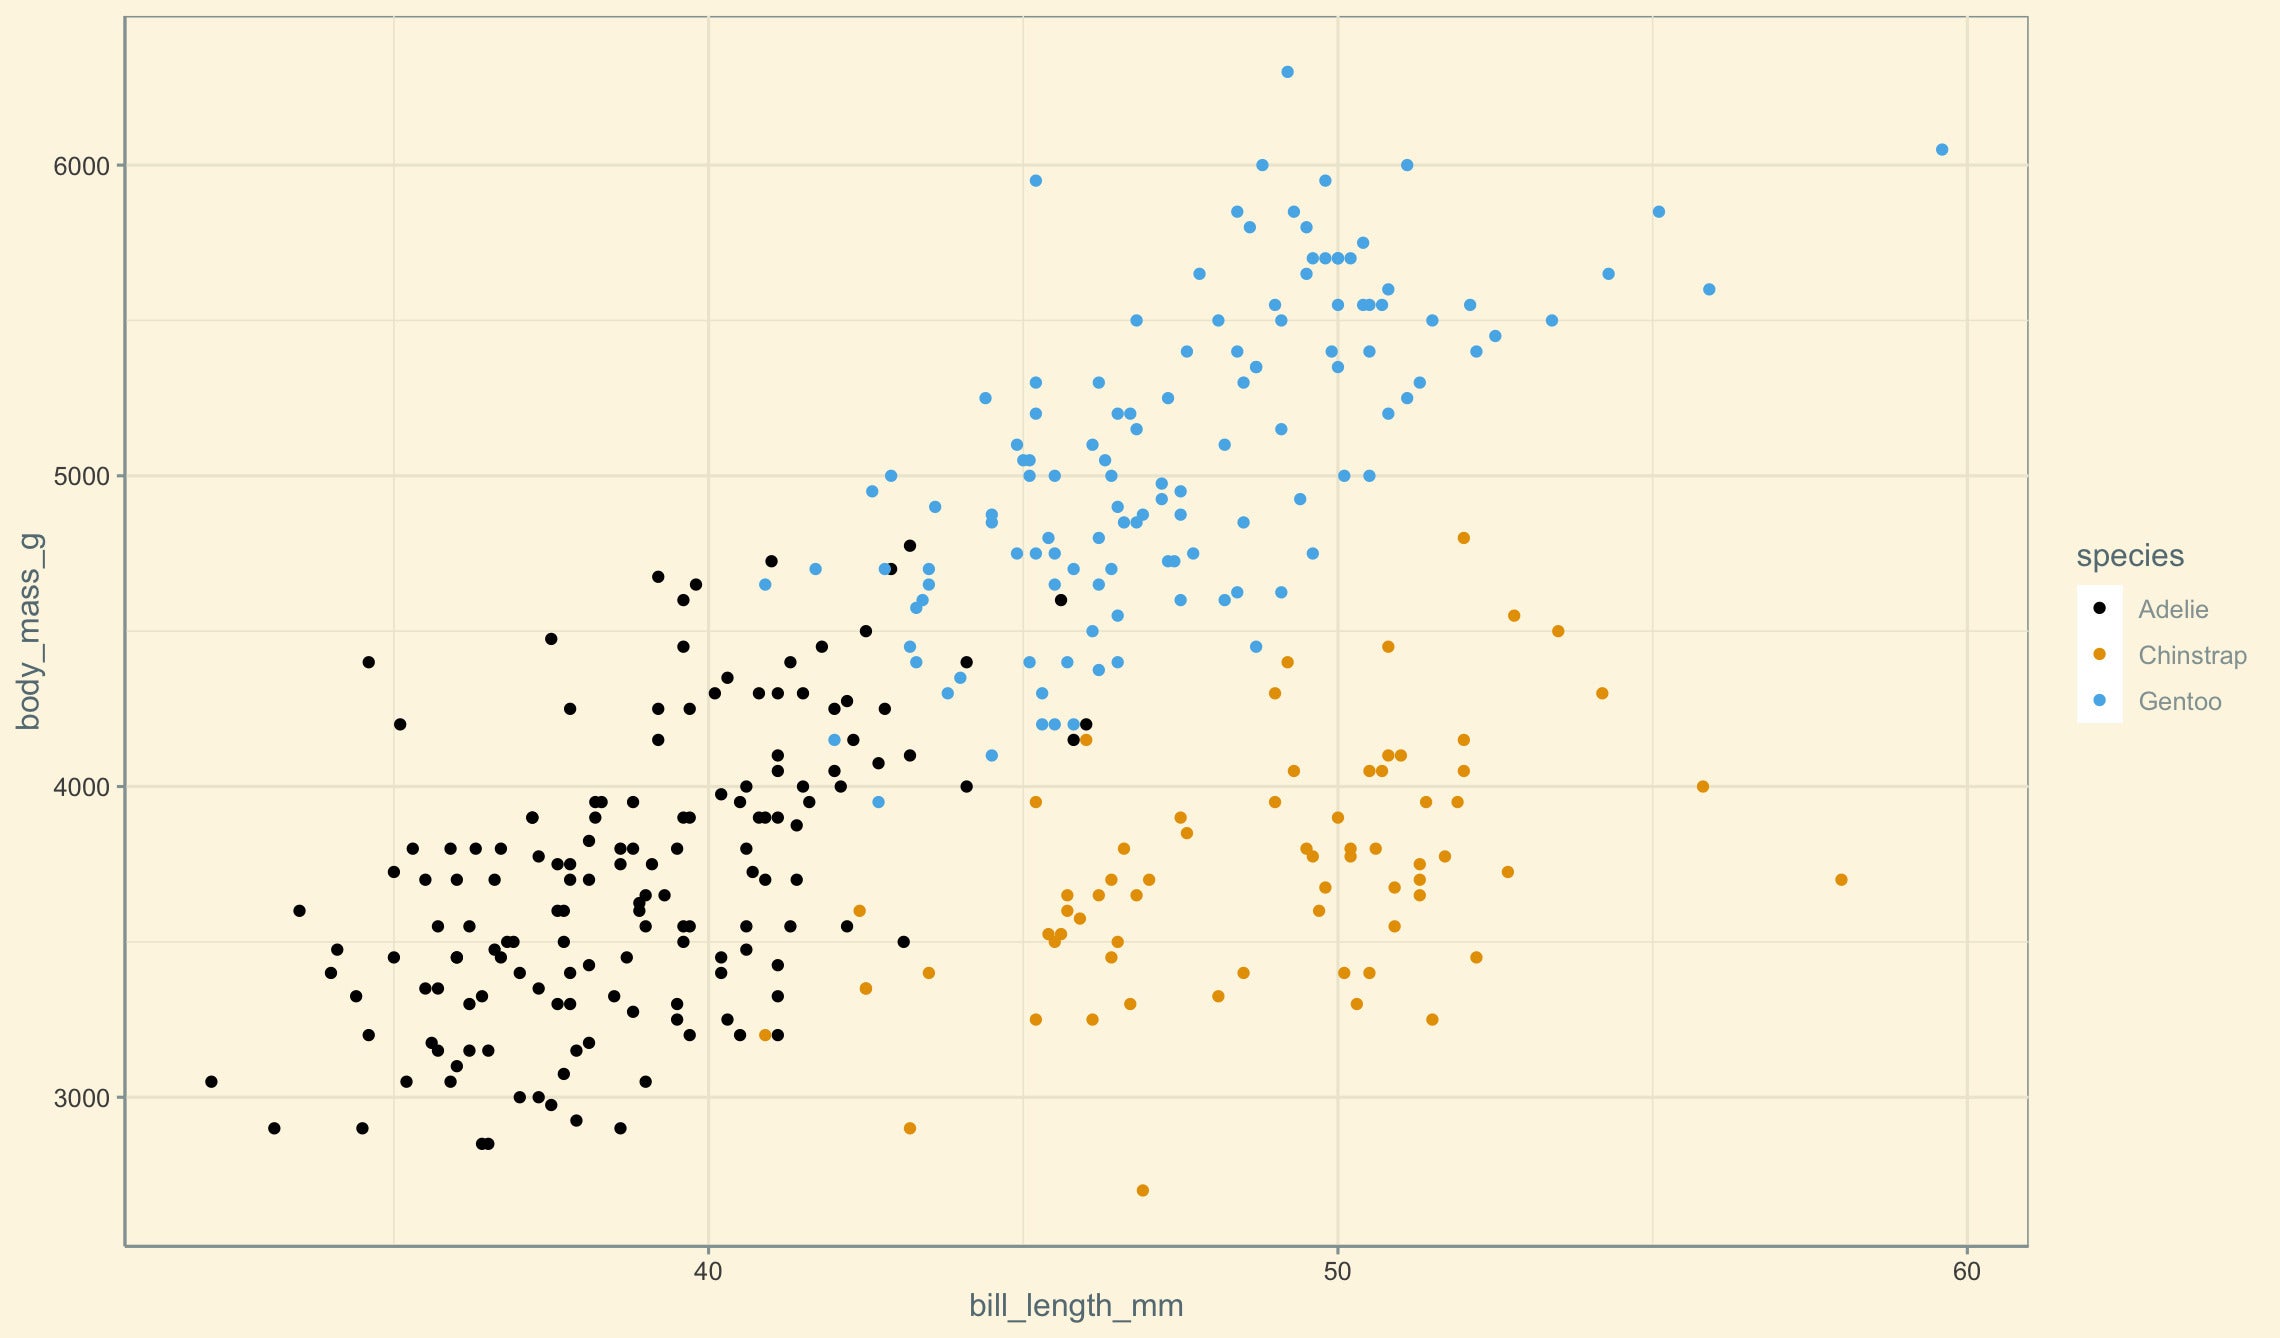
After installing one of these packages, you can usually use a new theme or color palette in the same way that you’d use a built-in ggplot2 theme or palette. Here’s an example with the ggthemes package’s solarized theme and colorblind palette:
library(ggthemes)
ggplot(penguins, aes(x = bill_length_mm, y = body_mass_g, color = species)) +
  geom_point() +
  ggthemes::theme_solarized() +
  scale_color_colorblind()
 Sharon Machlis
Scatter plot using a colorblind palette and solarized theme from the ggthemes package.
ggthemes is by Jeffrey B. Arnold and others and is available on CRAN.
Other theme and palette packages to consider:
ggsci is a collection of ggplot2 color palettes “inspired by scientific journals, data visualization libraries, science fiction movies, and TV shows” such as scale_fill_lancet() and scale_color_startrek().
hrbrthemes is a popular theme package with a focus on typography.
ggthemr is a bit less well known than those others, but it has a lot of themes to choose from plus a GitHub repo that makes it easy to browse themes and see what they look like.
bbplot has just a single theme, bbc_style(), the publication-ready style of the BBC, as well as a second function to save a plot for publication, finalise_plot().
paletteer is a meta package, combining palettes from dozens of separate R palette packages into one with a single consistent interface. And that interface includes functions specifically for ggplot use, with a syntax such as scale_color_paletteer_d("nord::aurora"). Here nord is the original palette package name, aurora is the specific palette name, and the _d signifies that this palette is for discreet values (not continuous). paletteer can be a little overwhelming at first, but you will almost certainly find a palette that appeals to you.
Note that you can use any R color palette with ggplot, even if it doesn’t have ggplot-specific color scale functions, with ggplot’s manual scale functions and the color palette values, such as scale_color_manual(values=c("#486030", "#c03018", "#f0a800")).
Add color and other styling to ggplot2 text: ggtext
The ggtext package uses markdown-like syntax to add styles and colors to text within a plot. For example, underscores surrounding the text add italics and two asterisks around the text create bold styling. For this to work properly with ggtext, the package’s element_markdown() function must be added to a ggplot theme, too. Syntax is to add the appropriate markdown styling to the text and then add element_markdown() to the element of the theme, such as this for italicizing a subtitle:
library(ggtext)
ggplot(snowfall2000s, aes(x = Winter, y = Total)) +
  my_geom_col() +
  labs(title = "Annual Boston Snowfall", subtitle = "_2000 to 2016_") +
  theme(
    plot.subtitle = element_markdown()
  )
ggtext is by Claus O. Wilke and is available on CRAN.
Convey uncertainty: ggdist
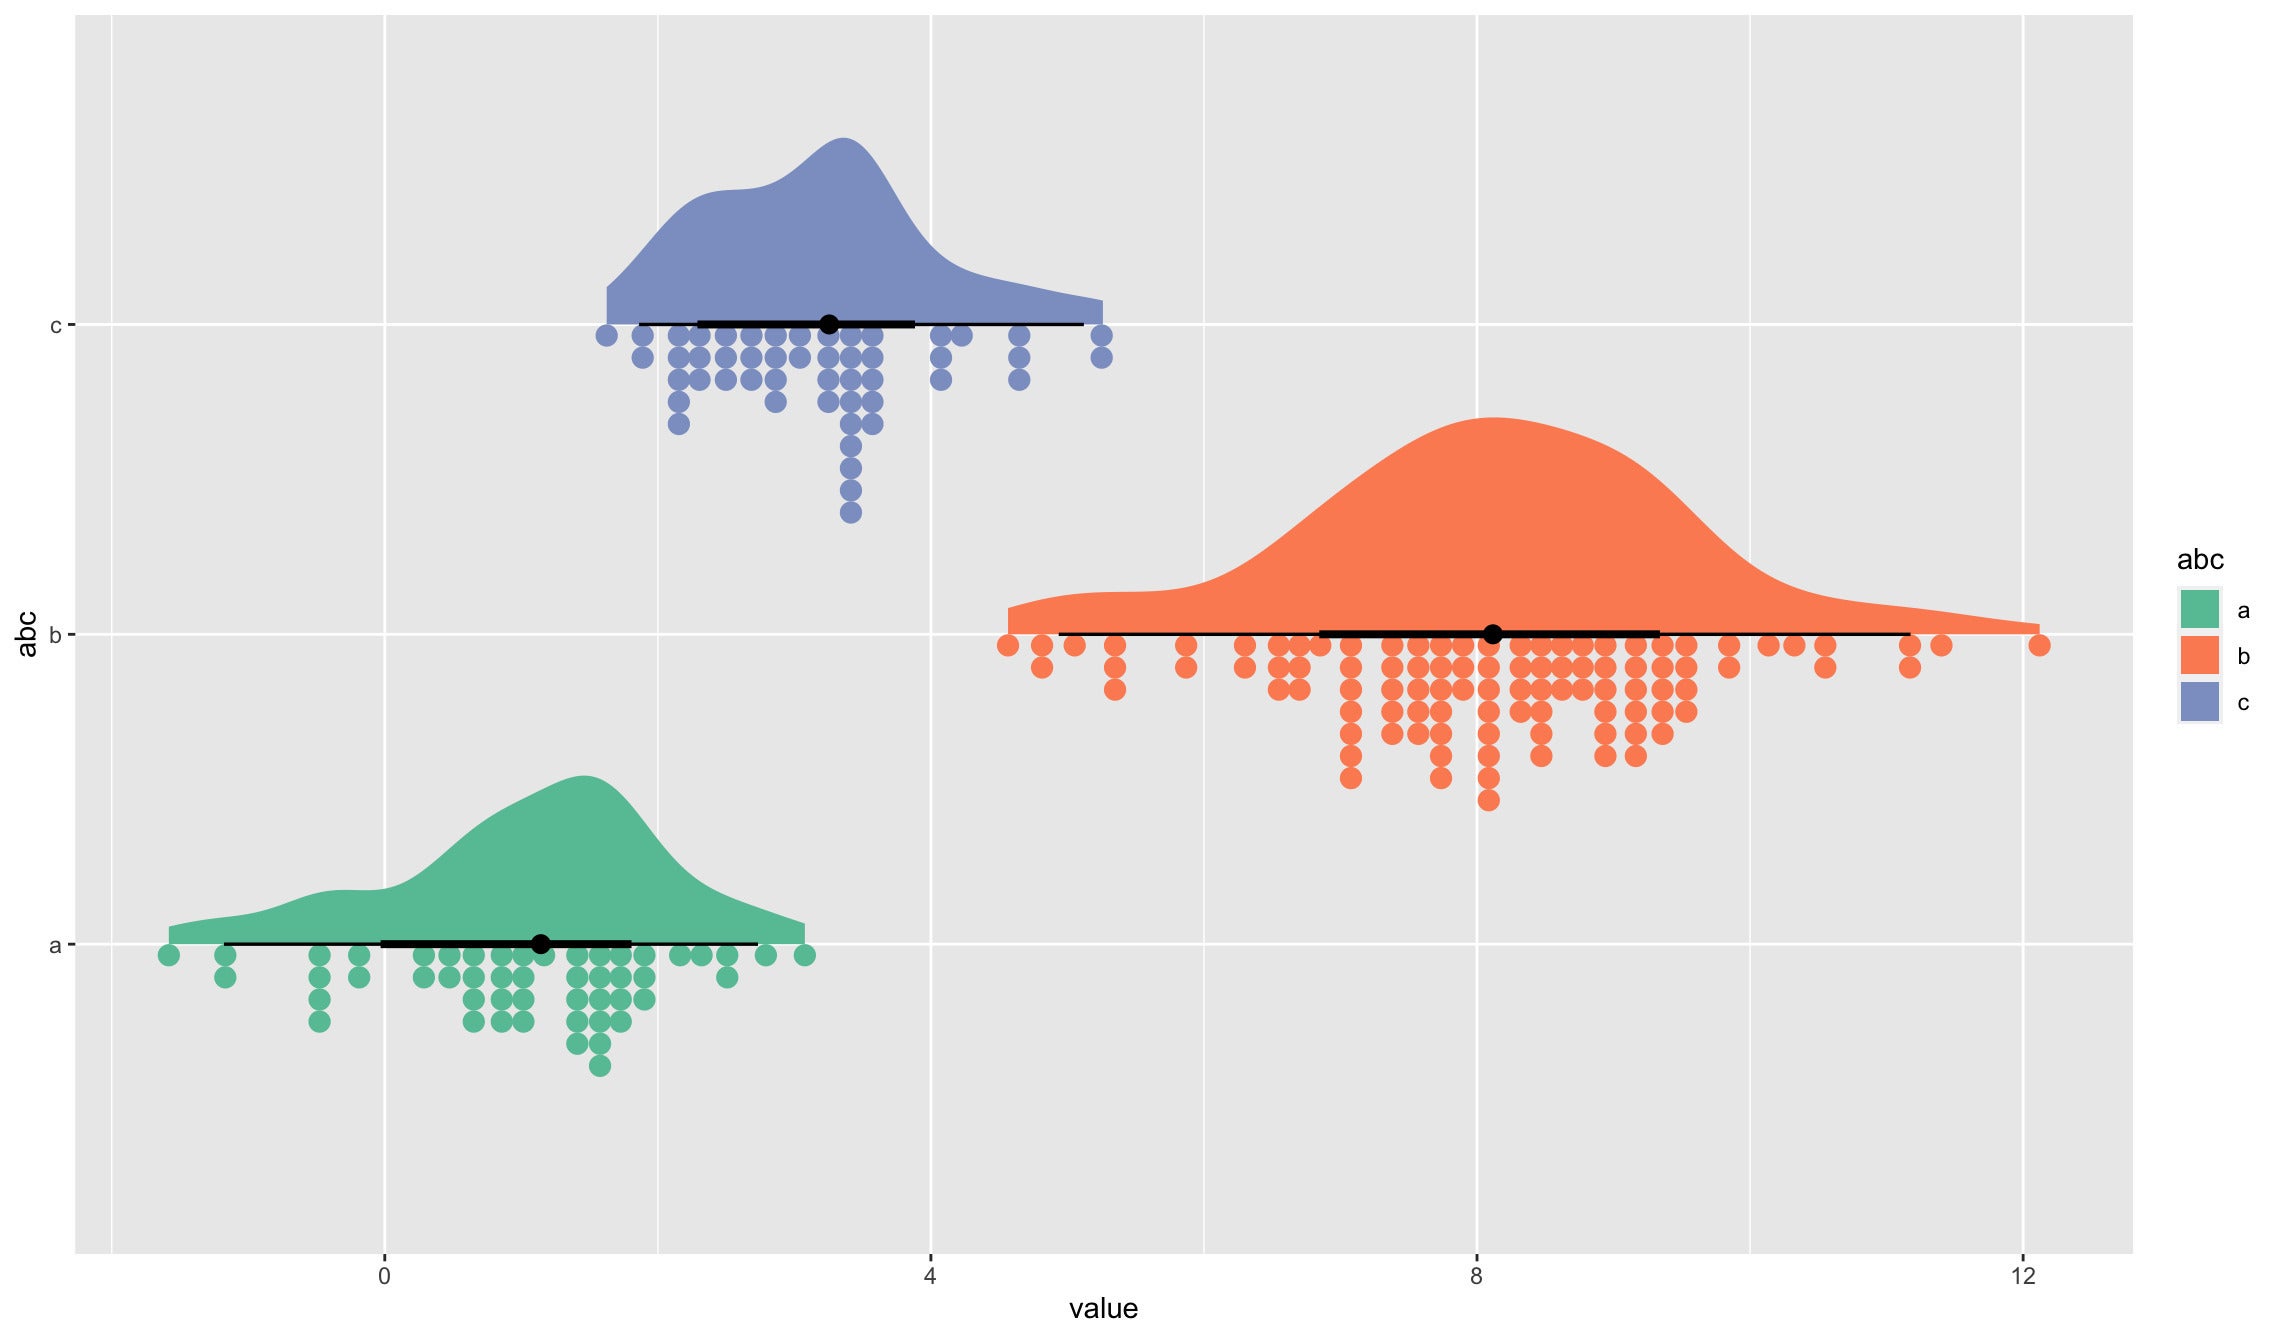
ggdist adds geoms for visualizing data distribution and uncertainty, generating graphics like rain cloud plots and logit dotplots with new geoms like stat_slab() and stat_dotsinterval(). Here’s one example from the ggdist website:
library(ggdist)
set.seed(12345) # for reproducibility
data.frame(
  abc = c("a", "b", "b", "c"),
  value = rnorm(200, c(1, 8, 8, 3), c(1, 1.5, 1.5, 1))
) %>%
  ggplot(aes(y = abc, x = value, fill = abc)) +
  stat_slab(aes(thickness = stat(pdf*n)), scale = 0.7) +
  stat_dotsinterval(side = "bottom", scale = 0.7, slab_size = NA) +
  scale_fill_brewer(palette = "Set2")
 Sharon Machlis
Rain cloud plot generated with the ggdist package.
Check out the ggdist website for full details and more examples. ggidst is by Matthew Kay and is available on CRAN.
Add interactivity to ggplot2: plotly and ggiraph
If your plots are going on the web, you might want them to be interactive, offering features like turning series off and on and displaying underlying data when mousing over a point, line, or bar. Both plotly and ggiraph turn ggplots into interactive HTML widgets.
plotly, an R wrapper to the plotly.js JavaScript library, is extremely simple to use. All you do is place your final ggplot within the package’s ggplotly() function, and the function returns an interactive version of your plot. For example:
library(plotly)
ggplotly(
ggplot(snowfall2000s, aes(x = Winter, y = Total)) +
  geom_col() +
  labs(title = "Annual Boston Snowfall", subtitle = "2000 to 2016")
)
plotly works with other extensions, including ggpackets and gghighlights. plotly graphs don’t always include everything that appears in a static version (as of this writing it didn’t recognize ggplot2 subtitles, for example). But the package is hard to beat for quick interactivity.
Note that the plotly library also has a non-ggplot-related function, plot_ly(), which uses a syntax similar to ggplot’s qplot():
plot_ly(snowfall2000s, x = ~Winter, y = ~Total, type = "bar")










Discussion about this post