The Research Analyst will conduct research for projects related to climate security and resilience.
Date posted
Apr. 8, 2024 4:30 pm
Application deadline
Apr. 26, 2024 5:00 pm
Organization
The Institute for Defense Analysis (IDA)
Location
Job description
Overview:
The Institute for Defense Analyses (IDA) is a non-profit federally funded research and development center. IDA provides answers to questions posed by the Department of Defense and other agencies that require careful analysis free of conflict of interest or political bias. IDA takes great pride in the high caliber and timeliness of its analyses, which are produced in an atmosphere that encourages independent thinking and objective results. Researchers within the Science, Systems, and Sustainment Division (S3D) of IDA are highly qualified, self-starting scientists and engineers who advise DoD officials and selected audiences on challenges of national and global significance. We provide independent analytical products to help solve problems facing senior executives and military officials across the Federal government. S3D scientists and engineers offer our sponsors insight into technology trends and the impact of emerging advances by bringing rigor to technology readiness assessments and independent perspectives on technology risks and mitigation strategies.
Responsibilities:
The Division has an immediate opening for a Research Analyst. The Research Analyst will conduct research for projects related to climate security and resilience. Applicants should have a demonstrated track record of conducting analysis using large climate data sets and with familiarity with geospatial datasets. Strong quantitative and problem-solving skills are critical. Duties will include, but not be limited to, data analysis and visualization, report writing, code development, presentations to disseminate results, or other project-related tasks as directed by the research staff.
Qualifications:
Education:
PhD in climate science, earth science, physical science or related field or
Masters in climate science, earth science, physical science or related field + 8 years of relevant experience
Demonstrated computer skills, preferably including experience with scripting languages such as Python and/or scientific modelling and computational abilities. Experience with cloud computing (e.g., AWS) is a plus.
Demonstrated analytical skills, preferably including experience analyzing large datasets and familiarity with geospatial datasets.
Candidates should submit a resume outlining their skill set, experiences, and education.
Ability to obtain and maintain a security clearance is required.
Successful completion of a background check is required.
Why work at IDA?
IDA, as a non-profit, is uniquely positioned to answer the most challenging U.S. security and science questions with objective and rigorous analysis leveraging extraordinary scientific, technical, and analytic expertise. This position is located in Alexandria, VA, just outside Washington, D.C.
Observes and participates in performing routine technical and scientific review and analysis of air quality data in the Monitoring Data Management Unit, Air Quality Planning Section (AQPS), Air Pollution Control Division (APC), Bureau of Air (BOA). Job ID 36686
Date posted
Apr. 8, 2024 4:45 pm
Application deadline
Apr. 17, 2024 5:00 pm
Organization
The Illinois Environmental Protection Agency (EPA), Bureau of Air (BOA)
Location
Job description
Position Overview
The Illinois Environmental Protection Agency (EPA), Bureau of Air (BOA), is seeking to hire an Environmental Protection Specialist I in their Monitoring Data Management Unit. The ideal candidate for this position will be organized, detailed and possess the ability to adapt to change in a collaborative, fast paced environment. The ideal candidate will also need to be able to communicate effectively verbally, electronically and in writing with both internal and external stakeholders.
The benefits of working at the EPA include a 37 ½ hour work week, a generous salary and benefits package (paid time off for vacation, sick or personal leave, holidays) pension and other retirement benefits, tuition reimbursement, and insurance eligibility on day one (medical, dental, vision, and life). We invite all qualified candidates to apply.
Essential Functions
35% 1. Observes and participates in performing routine technical and scientific review and analysis of air quality data in the Monitoring Data Management Unit, Air Quality Planning Section (AQPS), Air Pollution Control Division (APC), Bureau of Air (BOA);
Reviews routine technical and scientific data to ensure it meets specified data validation and reporting criteria.
Interacts with Agency staff in the receipt and processing of environmental data.
Assists higher level staff in communications with local agencies and the general public regarding daily reporting of air quality and pollution index data.
Compiles/prepares the annual Air Quality Report
Identifies potential ambient air monitor malfunctions
Essential Functions Continued
25% 2. Observes and assists higher level staff functioning as Duty Officer for forecasting and issuing statements for Air Pollution Episodes consistent with the requirements of 35 Ill. Adm. Code Part 244.
Compiling and reviewing routine technical and scientific weather charts, forecast maps and related data.
Updating AirNOW website with air quality forecasts
Reviewing real-time air quality data for episodic potential
Preparing daily air quality forecasts and Episode statements as required by regulation
15% 3. Assists higher level staff in accessing, reviewing and storing air quality data from remote Agency monitoring systems utilizing specialized data acquisition software:
Preparing routine technical and scientific summary reports and post products in data center
Submitting air monitoring data to United States Environmental Protection Agency (USEPA) utilizing USEPA software
Assists in configuration of data acquisition software and configuration of data network support equipment.
Archiving selected charts
Preparing routine technical and scientific reports in compliance with Unit procedures.
Essential Functions Continued
10% 4. Assists and trains with higher level staff to gain and further knowledge in performing routine technical and scientific data review and analysis of PM2.5 chemical specification data:
Utilizing the data analysis and reporting tool
Analyzing routine technical and scientific products and related PM2.5 data
Prepares for supervisor’s close review routine technical and scientific summary charts and reports.
Archives various products for future reference and reporting
10% 5. Assists higher level specialists in support of special air monitoring projects:
Compiling statistics on ozone, PM2.5 and conducive meteorological conditions
Participates in the development of data review, analysis and reporting schemes for the air toxics monitoring program.
Running data reports for information requests
Performs routine technical and scientific field investigations to better understand or characterize a special event or unusual occurrence.
Travels in the performance of duties.
05% 6. Performs other duties as assigned or required which are reasonably within the scope of the duties enumerated above.
Minimum Qualifications
Requires the knowledge, skill and mental development equivalent to the completion of four years of college with coursework in the physical, life or environmental sciences and requires either:
one year of professional experience in pollution abatement or a related field Or
completion of an agency approved training program.
OR
2. Requires a master’s degree with coursework in the physical, life, or environmental sciences.
Specialized Skills
Of the one year of required experience; requires one year of meteorology experience in the field of weather forecasting or air pollution forecasting; experience regularly working with complex data sets and data reports.
Preferred Qualifications
Prefers at least (1) one year of experience in air quality forecasting add or related weather forecasting.
Prefers at least (1) one year of experience preparing comprehensive reports of complex data review.
Prefers at least (1) one year of experience in maintaining and operating ambient air monitoring networks or similar multi-parameter data networks.
Prefers at least (1) one year of experience analyzing, interpreting, and reviewing scientific data and monitoring processes relating to ambient monitoring, meteorological study, or related environmental field.
Prefers at least (1) one year of experience in analyzing and interpreting pertinent state laws, rules, regulations, policies, or procedures and conveying them to individuals and municipal bodies.
Prefers ability to establish and maintain liaison with stakeholders outside of an Agency or organization, and professional staff of an organization.
Prefers the ability to follow oral and written instructions, to plan, schedule, and prioritize daily work.
Prefers college coursework (combined 18 – 20 semester hours) in Meteorology and Atmospheric Science.
Prefers the ability to utilize a personal computer and software applications and development of Excel spreadsheets
As an ABC6 News (KAAL-TV) employee, you’re surrounded by opportunity while experiencing forward-thinking philosophy. You’ll work among passionate, engaged professionals who work together to create the most entertaining content in Television and Digital platforms for our audience. Whether you’re searching for a career On-Air, Behind-The-Scenes, or Marketing & Promotion, there’s opportunity to learn, grow, and thrive within ABC6 News and Hubbard Broadcasting.
Job Overview
Covering weather in Southeast Minnesota and Northern Iowa is a meteorologist’s dream. We have snow, blizzards, thunderstorms, tornadoes, bitter cold and even heat waves. The Weekend Weather Anchor is responsible for producing and presenting a dynamic forecast while being in-tune with the station’s strategic goals. The Weather Anchor must be a storyteller and communicator on television and across our digital and social media platforms. This position will also be responsible for reporting 3 days per week.
It was a record wet March in parts of North Carolina, while the entire state experienced warm temperatures and the corresponding arrival of pollen season last month.
Frequent Rains Roll Through
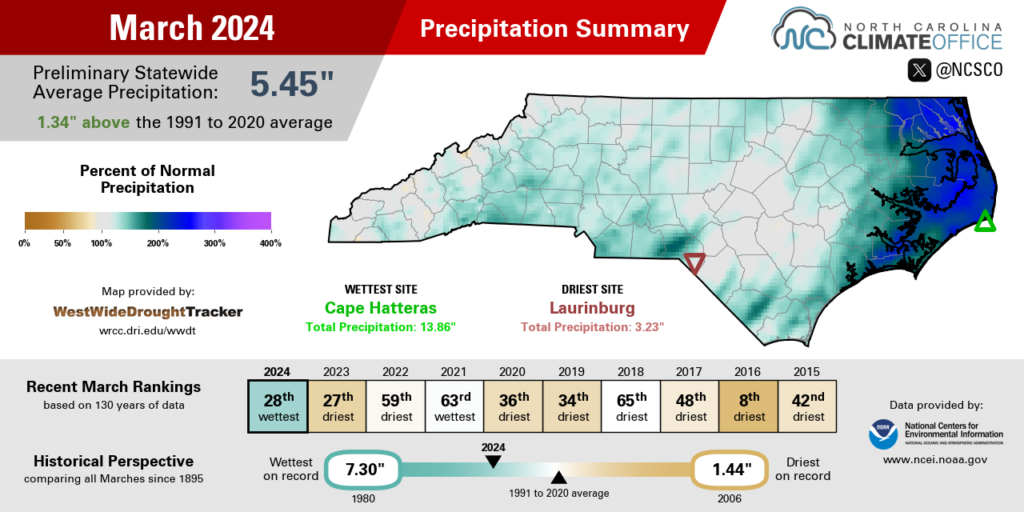
Heavy rain especially at the coast fueled a wet March for the state. NCEI reports a preliminary statewide average precipitation of 5.45 inches, which ranks as the 28th-wettest March out of the past 130 years.
A lion-like start saw back-to-back rain events in the first few days of the month. One low pressure system on March 1 and 2 brought two-day totals of more than 2 inches in parts of the southern Mountains and along the coastline, while another system just offshore on March 4 brought up to 4.34 inches at Cape Hatteras.
After just four days, Hatteras had already exceeded its normal March rainfall, but there was plenty more to come throughout the rest of the month.
March 6 saw more widespread rainfall with localized totals of more than 2 inches at the coast, while the Piedmont had more than an inch on March 9.
Later, a low pressure system on March 23 again soaked the coastline, while the entire eastern half of the state was in front of the firehose on March 27 and 28, with up to 2.97 inches in Rockingham.
The March 2024 precipitation summary for North Carolina.
For the month as a whole, Hatteras totalled 13.86 inches – more than three times its normal monthly rainfall – to easily eclipse the 11.20 inches from 1989 and become the wettest March on record there. It was also a record wet month in Elizabeth City, which had 9.25 inches in total.
Thanks to the early-month rainfall, it was also a notably wet month in the Mountains. Tryon had its 12th-wettest March in the past 104 years, and it was the 11th-wettest March for Lake Lure since 1949.
Following a dry February, the wet March was a welcome sight, even if the repeated rainfall and offshore storm systems wreaked havoc on the roads up and down the Outer Banks.
Moderate Drought (D1), which returned to parts of eastern North Carolina at the end of February, has since shrunk to cover only parts of Greene, Lenoir, and Pitt counties. On-the-ground conditions, particularly streamflow levels, saw good recoveries in March, but precipitation deficits of 2 to 3 inches remain in parts of the Coastal Plain since the beginning of 2024.
A Spring Sensation in the Air
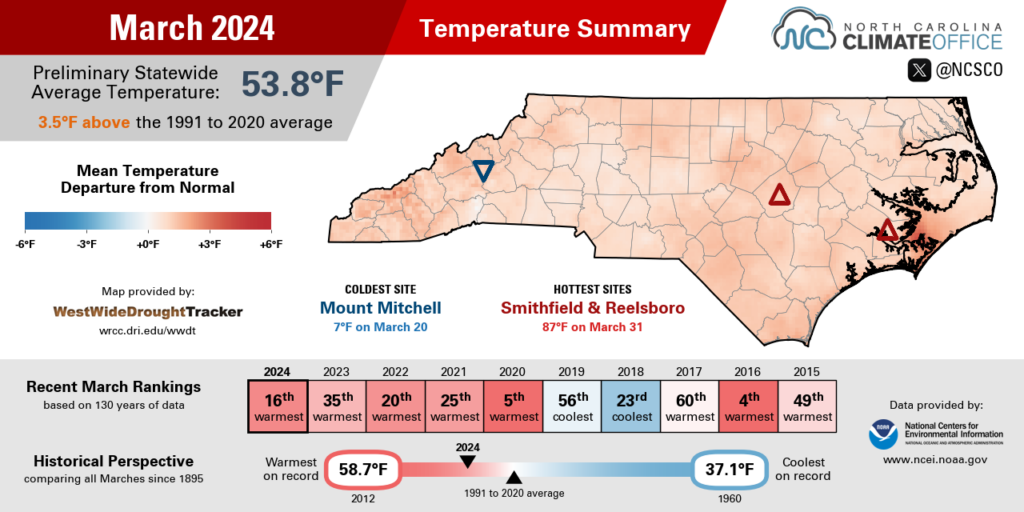
Consistently above-normal temperatures throughout the month made for an overall warm March in North Carolina. The National Centers for Environmental Information (NCEI) notes a preliminary statewide average temperature of 53.8°F and our 16th-warmest March since 1895.
Our average temperatures were 3 to 6 degrees above normal, which left this among the top ten warmest Marches observed in some areas. New Bern and Raleigh each tied for their 9th-warmest March on record, while it was the 9th-warmest in Fayetteville and the 6th-warmest in both Greenville and Hickory.
The warmth started early, as high temperatures hit the low 70s on March 3 with high pressure overhead. A similar pattern on March 12 to 14 helped temperatures warm into the 80s, including 82°F in Charlotte – its warmest day of the year to that point, and more than two weeks before than the average first day that warm, April 1.
The March 2024 temperature summary for North Carolina.
The most significant cooldown of the month happened from March 24 to 26 as high pressure to the north funneled colder air across the state. On the morning of Monday, March 25, low temperatures dipped into the 20s in parts of central and western North Carolina, which resulted in a light freeze for some vegetation.
During the final week of the month, our temperatures were again on the rise, climbing from the 50s on March 27 into the 80s by March 31. Our Sandhills ECONet stations in Hamlet and Lilesville both hit 85°F and set new daily record high temperatures dating back to 2008.
The prevalent warmth during March is perhaps best evidenced by the number of days with temperatures at or above 70°F. There were 15 such days in Raleigh, 17 in Wilmington, and 20 in Lumberton. Farther west, Hickory had 14 days that warm and Lincolnton had 16 days in the 70s or above, which was the 4th-most on record at both sites, and the most in any March since 2016.
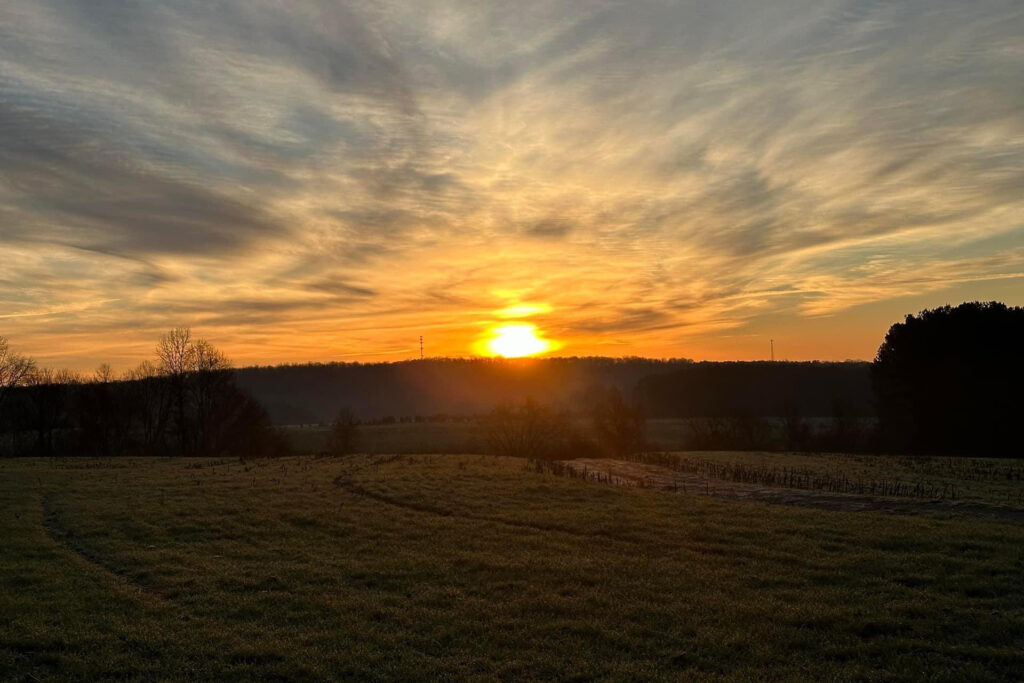
The Easter Sunday sunrise in Cabarrus County on March 31. (Photo by Jim Sells, courtesy Johnny Caudle/@caudleweather)
The Pollen-pocalypse Arrives
If your allergies have already been active this spring, then you can blame the weather, as it was primed for peak pollen production in March.
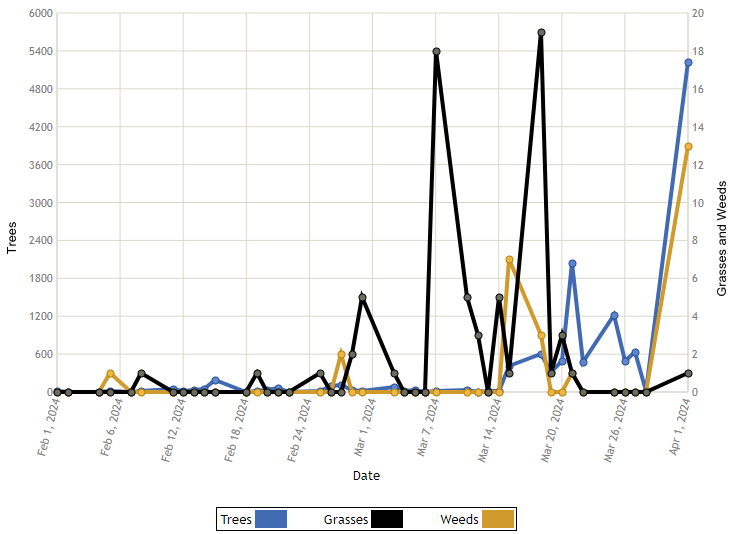
It starts with our temperatures, which began warming to spring-like levels back in February and urging vegetation of its winter dormancy. As we noted in our February climate summary, leaf-out began 2 to 3 weeks earlier than normal this year, so that got the pollen season off to a fast start. We saw the first uptick in grass pollen on March 1, while typically, those levels don’t begin increasing until late March or early April.
Rain can be a blessing and a curse when it comes to pollen, and it certainly was a bit of both last month. Showers in the first two weeks of March helped grasses and other vegetation green up and reach maturity more quickly, at which point they sent even more pollen into the air.
More rain later in the month finally helped wash some of that pollen away, but by that point, the nasal nuisance had been fully unleashed. Grass pollen levels hit 17.9 grains per cubic meter on March 8 and 19.2 grains on March 18, based on the North Carolina Division of Air Quality’s data from Raleigh. Those are the two highest observed March grass pollen values in its online archive dating back to 2006.
Daily pollen concentrations, in grains per cubic meter, measured in Raleigh in February and March 2024. (From NC DAQ Pollen Monitoring)
Between those rain events, winds were a factor as well. Gusts in excess of 30 mph on March 10, March 20, and March 30 helped get the pollen swirling in the air at regular intervals throughout the month.
That culminated in a spike in tree pollen levels on April 1, with 5,219 grains per cubic meter – the highest ever daily count observed by NC DAQ in Raleigh – primarily from mulberry, pine, oak, sweet gum, and ash trees.
Because of its direct link with temperatures, our spring pollen season is feeling the effects of climate change. Research at NC State’s College of Natural Resources last year noted that the pollen season has expanded by almost a month over the past 30 years, beginning about 20 days earlier and lasting about 10 days longer.
That extra time allows for more overall pollen production, and when the weather lines up, it can make for more extreme allergy-aggravating days as we’ve seen over the past month. That’s nothing – or, perhaps, something – to sneeze at.
RADAR is the acronym for RAdio Detention And Ranging, it is a process in which an electromagnetic wave is transmitted through an antenna and in the presence of an object this radio wave bounces towards a receiving antenna. The reflected magnitude and phase of the signal depend on the characteristics of the object (e.g. size, shape, orientation, and material). Radar frequencies are classified in bands by the Institute of Electrical and Electronics Engineers (IEEE) depending on their rangeon the electromagnetic spectrum such as L-, S-, C-, X- and Xu-Band which ranges are 1-2GHz, 2-4GHz, 4-8GHz, 8-12Ghz and 12-18GHz, respectively.
One of the most common radar techniques is the Synthetic Aperture Radar (SAR) which creates 2D images, like photograph in optical systems. SAR systems on satellite platforms has become an important data acquisition method known as remote sensing. In satellite data, the smaller available spatial resolution is 5m xa 20m but usually averaged to 20m x 20m for easier interpretation. However, this coarse resolution limits the ability of airspace systems to differentiate features in the scanning area (e.g., soil, vegetation, water bodies). Hence, the use of ground radar systems can provide high-resolution data reducing this spatial uncertainty.
In the Meteorology Department at the University of Reading, we have developed a pair of ground-radar systems, a UAV-Radar and a Radar-Rig, which operate at a C-band frequency range using a Frequency Modulated Continuous Wave (FMCW). The radar under the FMCW method transmits a radio wave which changes linearly over a wide range of frequencies providing a better range resolution compared with unmodulated systems.
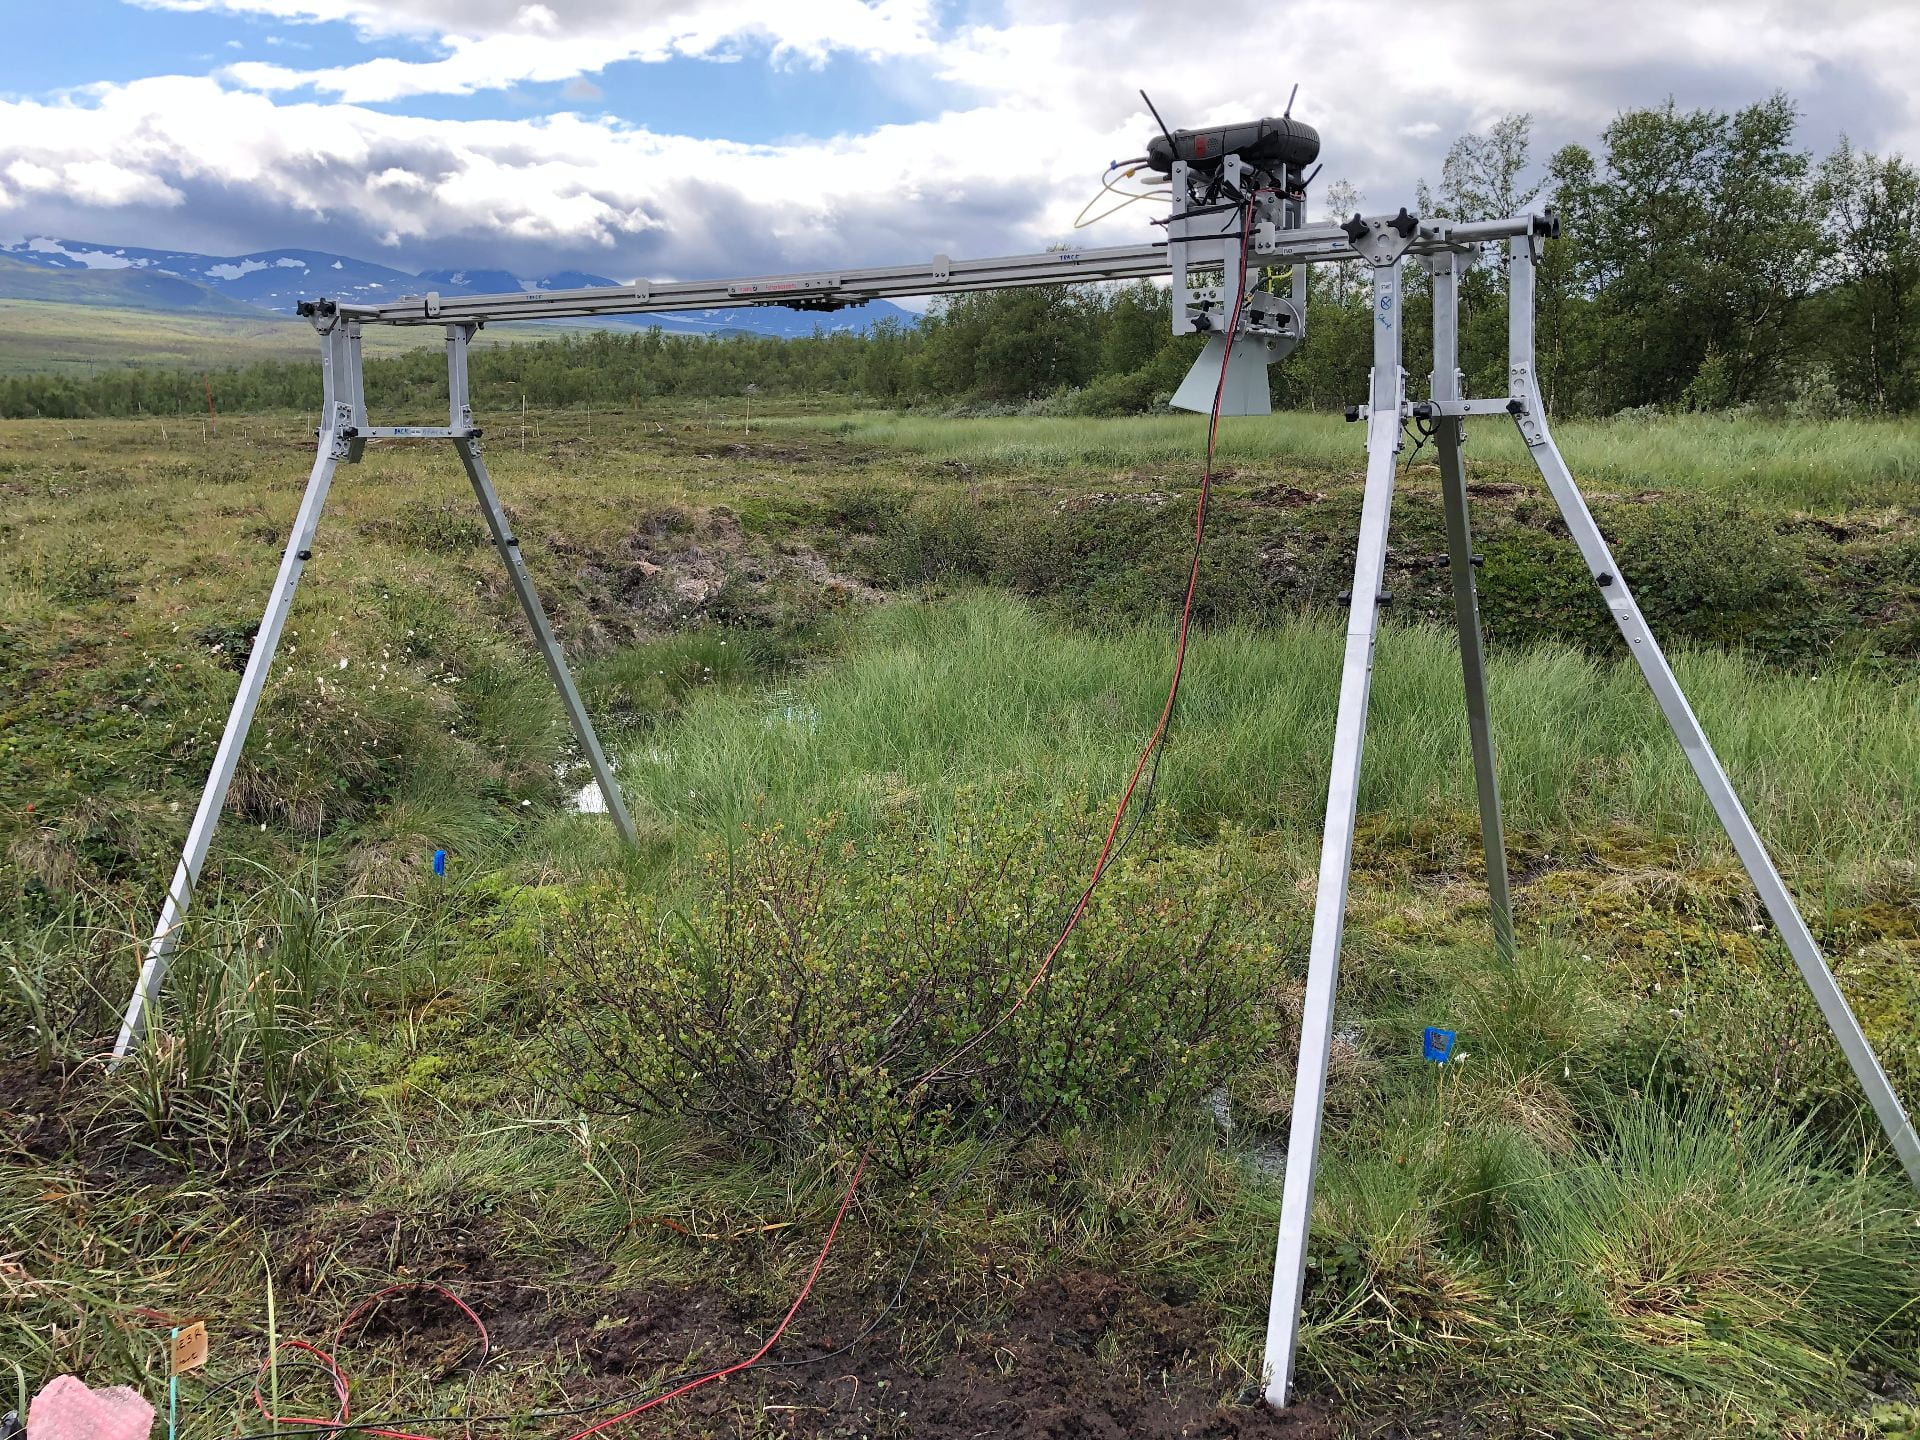
The UAV-Radar consists of a C-band system, an array of path-antennas, and a small single-board computer (Figure 1a). The radar operates a frequency range from 5.2 GHz to 6.0 GHz, using one transmitter and two receiver antennas. The construction of a mechanical structure, known as gimbal, provides a movement of the antennas along the vertical direction in degrees and across the horizontal direction for a side-looking or down-looking antenna setting. Additionally, the antennas can be rotated, offering a configuration of different polarisation modes (VV, HH and VH). Similarly, the Radar Rig is a software-controlled instrument running radar from a starting to an ending point on a 3m rail (Figure 1b). The instrument comprises a motor unit, a Vector Network Analyser (VNA) and two horn antennas, one transmitter and one receiver. The software allows different VNA configurations (e.g., frequency range [4GHz to 8GHz], and power) as well as the setting of the motor unit (e.g., start position, scan length and increments). Antennas can be moved vertically along the track in degrees and rotated to provide different polarisation modes. The configuration flexibility of both systems allows a variety of imaging modes such as Real-Beam mapping, Synthetic SAR, SAR Interferometry, 3D tomography and Tomographic Profiling (TP, Morrison and Bennett 2014). The different polarisation modes provide information about the structure of the scanned area. For example, VV mode is sensitive to bare soil and water, whereas VH is to vegetation canopy (leaves and branches).
Figure 1. a) UAV-Radar system consists of C-band radar, patch antennas, and a single-board computer.
Figure 1. b) Radar-Rig consists of C-band radar, horn antennas, and a motor unit.
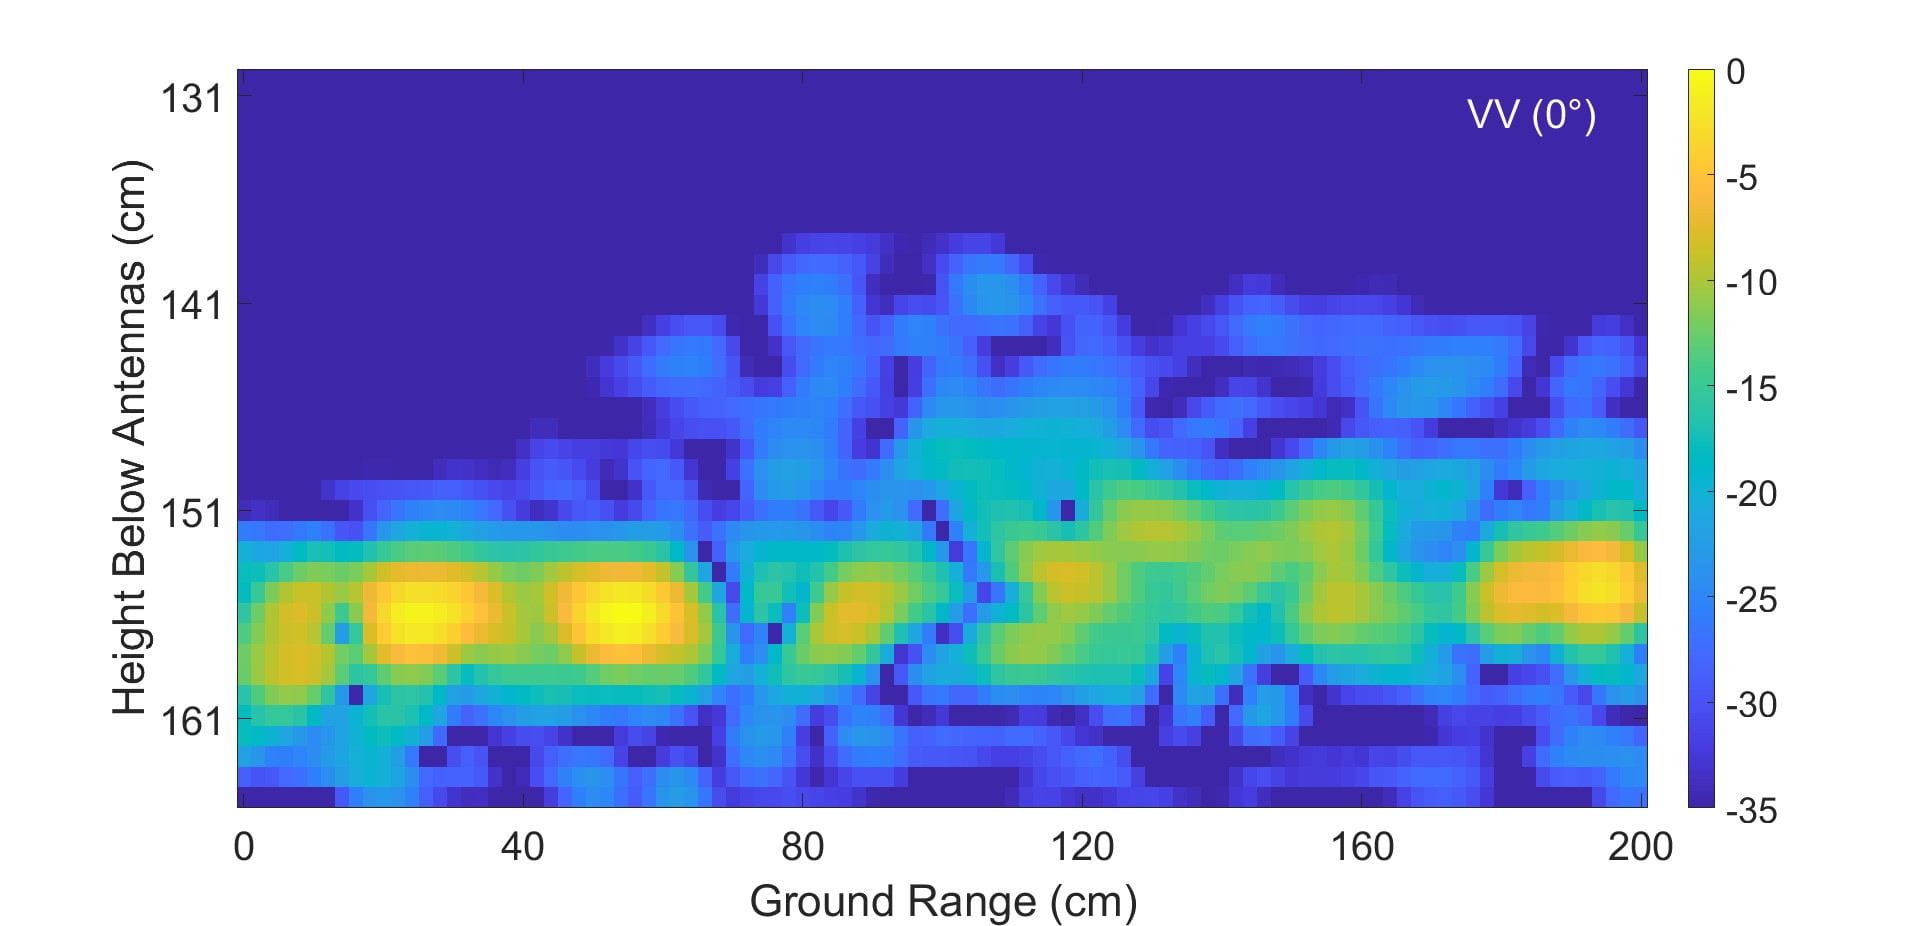
The TP method is an analogue to SAR, with the difference of the antennas rotated 90° looking along the track direction. This method allows for vertical backscatter canopy profiles. Both systems have been tested under the TP approach. The UAV-radar system has a high-resolution mapping approximately of 0.5 m along the flight path and 0.5 m vertically (Figure 2), whereas a smaller resolution is achieved with the Radar-Rig (0.22 cm along-track direction, and 3.75 cm vertically, Figure 3).
Figure 2. Tomography profiling image with reconstruction angle of 0° degrees. Path length of 140 m over trees, gaps in the images correspond to a re-setting time of radar. The top figure is co-polarisation (HH) and the bottom is cross-polarisation (VH). Data was collected in the Stoflaket wetland in northeast Sweden.
Although similar platforms exist (Schartel et al. 2018; Charvat, Kempell, and Coleman 2008), the ones developed at the Meteorology Department (University of Reading) are the first of their kind for environmental monitoring applications (e.g. soil moisture, biomass density, etc). The images obtained in a field by these two ground radar systems can be upscaled to interpreted what the satellite imagery are really “seen”. The results will help to understand how the backscatter signal arises spatially and temporally, the issues that can complicate its interpretation and factors that can contribute to signal distortion. This will allow a more complete and timely exploitation of satellite data.
Figure 3. (a) Tomography profiling image with projected angle 0°. Path length of 3m over a dwarf shrub. This top figure (a) is co-polarisation (VV). Data was collected in the Stoflaket wetland in northeast Sweden.
Figure 3. (b) Tomography profiling image with projected angle 0°. Path length of 3m over a dwarf shrub. This bottom figure (b) is cross-polarisation (VH). Data was collected in the Stoflaket wetland in northeast Sweden.
References and Further Reading:
Charvat, Gregory, Leo Kempell, and Chris Coleman. 2008. “A Low-Power High-Sensitivity X-Band Rail SAR Imaging System [Measurement’s Corner].” IEEE Antennas and Propagation Magazine 50 (3):108-15. doi: 10.1109/map.2008.4563576.
Morrison, Keith, and John Bennett. 2014. “Tomographic Profiling—A Technique for Multi-Incidence-Angle Retrieval of the Vertical SAR Backscattering Profiles of Biogeophysical Targets.” IEEE Transactions on Geoscience and Remote Sensing 52 (2):1350-5. doi: 10.1109/tgrs.2013.2250508.
Schartel, Markus, Ralf Burr, Winfried Mayer, Nando Docci, and Christian Waldschmidt. 2018. “UAV-Based Ground Penetrating Synthetic Aperture Radar.” In 2018 IEEE MTT-S International Conference on Microwaves for Intelligent Mobility (ICMIM), 1-4.
About sdriscoll
https://twitter.com/SimonDriscoll_ Researching machine learning and thermodynamics of Arctic sea ice. Part of SASIP (2021-present) @UniofReading (Schmidt Futures). Previously DPhil Physics @UniofOxford (climate/volcanoes/geoengineering). Also nuclear war/winter + X-risk.




 Abstract: