Categories
Weather

About Extreme Drought: What to Know This Spring and Beyond

With April showers staying away, record hot temperatures in recent weeks, and rainfall deficits continuing to increase, Extreme Drought conditions have been expanding explosively across North Carolina this month.

With drought impacts becoming more apparent, including water restrictions being implemented in parts of the state, we recently assembled a panel of drought experts from the North Carolina Drought Management Advisory Council to discuss what’s going on with this ongoing drought, and what may happen next.

This included a drought primer from Assistant State Climatologist Corey Davis, water resource perspectives from DMAC chair Klaus Albertin at the NC Division of Water Resources, forestry and wildfire perspectives from Fire Environment Staff Forester Jamie Dunbar at NC Forest Service, and the current weather outlook presented by Senior Service Hydrologist Barrett Smith at NWS Raleigh, as well as bottom-line takeaways about the drought.

This post is a summary of that webinar, held on April 23, 2026. The full recording is available to watch on YouTube.

The Latest Drought Primer

While the past six weeks have been noticeably dry, the current dry spell actually dates back more than half a year, to the late summer of 2025. By mid-August, regular rainfall had ended, and a quiet end to the hurricane season along our coastline meant we missed out on the usual tropical contribution to our average precipitation.

A La Niña-affected winter brought the typical dry conditions in our part of the country, and despite more frequent rain events in February, we were still left with widespread Severe Drought entering the spring.

Since mid-March, a summer-like weather pattern with high pressure overhead has meant unseasonably warm temperatures and little rainfall. That has helped drought intensify, and more than 40% of the state is now in Extreme Drought – the second-most severe category in the US Drought Monitor’s classification system.

The US Drought Monitor map for North Carolina as of April 21, 2026
The latest US Drought Monitor map for North Carolina, released on April 23, 2026.

As defined based on historical percentiles, Extreme Drought conditions tend to occur 2 to 5% of the time, or every 20 to 50 years, on average, at any given location and time of year.

Parts of far western North Carolina were most recently in that category during the 2016-17 drought that included a damaging fall fire season, while the last widespread Extreme Drought elsewhere was during our state’s worst drought on record in 2007 and 2008.

While this drought’s emergence may seem sudden, and a hot and dry April has indeed accelerated its development, it’s truly a long-term phenomenon by now. Since last August, our precipitation deficits have steadily increased to more than 12 inches across almost the entire state, with barely half of the normal precipitation in many areas.

This calendar year is also off to a record dry start in places like Charlotte, Monroe, Raleigh, and Laurel Springs, with each site more than six inches below normal since January 1. That tells the story of the lack of meaningful recharge over the winter, and the continuing dryness so far this spring.

A map of departures from normal precipitation in North Carolina over the 120 days ending on April 21, 2026
Precipitation departures from normal from December 23, 2025, to April 21, 2026. (Map from the SRCC Integrated Water Portal)

Naturally, this historic dryness and the return of Extreme Drought are drawing comparisons to the 2007 event, and the overall rainfall deficits are indeed similar. Raleigh’s current shortfall since mid-August stands at 16.35 inches, surpassing the maximum deficit of 12.73 inches in December 2007. And at 15.11 inches below normal in this drought, Charlotte is closing in on its peak deficit of 17.17 inches in 2007.

However, the biggest difference between these two events is their timing: the 2007 drought rapidly advanced during a hot, dry summer, while our current drought has taken shape mostly in the cool season, when evaporation rates and water demands are lower.

That’s why we’re not yet seeing those 2007-level impacts, despite the similar rainfall deficits. For instance, Falls Lake is currently 2.76 feet below its target, a far cry from its record low of 8.88 feet down in November 2007.

The main impacts being felt now include brown, slow-growing lawns and crops struggling to take root without supplemental irrigation, and amid low topsoil moisture levels that have taken a nosedive in recent weeks, as measured by our ECONet.

A graph of soil moisture conditions compared to historical percentiles at our Whiteville ECONet station
Observed soil moisture compared with historical percentiles from our Whiteville ECONet station over the past year.

Water Resource Perspectives

One of the first signs of the worsening drought this winter, and one of the most alarming signs of its severity now, is the streamflow status. With minimal rain over the past six weeks, streamflows are at record lows for this time of year at nearly all USGS monitoring gauges statewide.

As another sign of the entrenched dryness, groundwater levels are also very low. Among the North Carolina Division of Water Resources’ 85 Drought Indicator Wells, 20 are now at record low monthly levels, spanning from Bryson City in the west to Elizabeth City in the east.

Lakes and reservoirs are also feeling the impacts due to the lack of rain and upstream inflows. Along with the declining levels in Falls Lake, which is the main water supply for Raleigh and surrounding areas, Lake Norman near Charlotte is also more than two feet below its target level.

However, thanks to a bit of forward thinking during the emerging drought last fall, these lakes aren’t as low as they could have been. Many operators held their lakes at higher-than-normal levels over the winter to ease the challenge of the spring fill, just in case drought persisted like it has.

A map of real-time streamflow conditions across North Carolina on April 22, 2026
Real-time streamflows, including daily record lows (red), on April 22, 2026. (Map from the USGS National Water Dashboard)

Still, some are struggling to reach their summer targets. Despite starting March more than five feet above normal, Fontana Lake in far western North Carolina is now more than 7 feet below its target, which continues to increase until mid-May.

While these reservoirs – by design – have months of water left in reserve, some local towns and water systems are already implementing water restrictions to make sure those supplies last in the event of a prolonged drought this summer.

Earlier this week, the City of Raleigh implemented mandatory once-per-week outdoor watering limits, while Rocky Mount is requesting similar but voluntary conservation efforts. Charlotte Water has also requested voluntary conservation.

For more information about any restrictions affecting you, check with your local water utility, as each has different conservation triggers determined by its Water Shortage Response Plan.

Even without an official request from your local utility, smart and cost-saving conservation steps to implement include watering outdoors before 10 am to limit evaporation, fixing leaking faucets, and waiting until dishwashers and washing machines are full before running them.

An aerial photo of Falls Lake showing lower levels
An aerial view of Falls Lake on April 11 showed areas of exposed shoreline due to declining lake levels. (Photo by Brian Powell)

Forestry and Wildfire Perspectives

Climatologically speaking, spring is the primary fire season in North Carolina, as the still-dormant fuels coming out of the winter burn easily before the vegetation has fully greened up and leafed out. Drought tends to make these fuels even drier and our fire seasons even worse, and this spring has been no exception.

According to preliminary statistics from NC Forest Service, there have been 4,224 total wildfire incidents on state and private lands in 2026 through April 21. That’s a significant increase from the 10-year average of 2,614 incidents through the first four months of the year.

The largest incidents so far include the 1,410-acre East Tower fire on the Alligator River National Wildlife Refuge, this month’s 748-acre Rosindale Road fire in Bladen County, and the late March Cane Creek fire that burned 574 acres in Wilkes County.

While our spring fire seasons are often active, several weather factors have made this one even worse. The ongoing drought is keeping dead fuels like fallen tree branches at record dry levels, especially in Helene-damaged areas that are still strewn with debris and difficult to access. Several frosty nights have also slowed the green-up process as live vegetation comes out of its winter dormancy. And windy days have helped spread newly started fires.

A photo of smoke from the Rosindale Road fire in Bladen County
Smoke billows from the Rosindale Road fire in Bladen County earlier this month. (Photo by Kyle Elkins via WECT News)

Those factors all prompted the North Carolina Forest Service to implement a statewide burn ban on March 28, and it has been in effect since then. This covers all outdoor burning, including backyard debris burns, campfires, and fireworks.

So far, this burn ban is having an effect at reducing new fire starts and freeing up local resources to combat ongoing incidents and move across the state to assist with other fires.

Burn bans are common in Extreme Drought since the dry landscape makes fires even easier to ignite and spread uncontrollably. Similar statewide burn bans were issued during the 2007 drought — first between August 21 and September 18, and again beginning on October 15 — although that event’s primary fire activity happened the following spring, including the long-lasting Evans Road fire that began in June 2008.

The potential for large coastal fires is still present this spring, and the current situation in south Georgia with several large incidents including the 17,000-acre Pineland Road fire shows how impactful the drought and how volatile the fuels are right now. Any thunderstorms in the next few months could be both a blessing and a curse, bringing needed rain but also the possibility of fire-starting lightning strikes.

That’s why our coastline remains at an above-normal risk of significant wildland fires in May, and why the burn ban will likely continue until more rain arrives to reduce the fire danger and get any ongoing fires under control.

A map of the national significant wildland fire potential outlook for May 2026
The significant wildland fire potential outlook for May 2026 highlights the ongoing risk along the coast. (Map from NIFC)

Current Weather Outlook

The latest forecast offers a bit of hope, but nothing close to drought-busting rainfall before the end of the month. Over the next week, we’ll see a pair of cold fronts move through: the first approaching on Saturday, and the second arriving by next Tuesday.

Along with offering some breaks from the summer-like temperatures, these should bring rain showers across much of the state. Current forecasts are showing weekly totals of a half-inch to an inch of rain. That’s certainly an improvement over where we’ve been, although it’s still drier than our weekly average rainfall at this time of year.

Beyond that, the Climate Prediction Center’s 8- to 14-day outlook through the first week of May tilts toward above-normal precipitation, and their three-month outlook for May through July leans wetter for eastern North Carolina.

A map of 7-day forecasted precipitation for North Carolina
The 7-day precipitation forecasts show a half-inch to an inch of rain possible for much of the state this week. (Forecast by WPC; graphic by NWS Raleigh)

While we track our developing drought, we’re also watching the developing ENSO pattern in the Pacific, as that could have a big impact on us later this year. After two consecutive La Niña winters, it’s now very likely that we’ll shift to the opposite phase, El Niño, over the summer.

Initially, that may not be a good thing for our drought. Because it strengthens upper-level winds over the tropics that can shear apart developing storms, El Niño events tend to see a reduction in Atlantic tropical activity, as predicted in initial outlooks by Colorado State University and others. Like last fall, that could deny us the tropical rainfall we expect at that time of year.

By late fall and early winter, more relief could arrive as El Niño’s primary atmospheric impacts kick in. A stronger jet stream anchored to our south should bring moisture and storm systems our way, which should mean wetter weather for at least a few months.

Whether we’re stuck in a drought or welcoming back the rain, one way you can help us track conditions is by joining CoCoRaHS as a volunteer precipitation observer. In addition to making daily rainfall observations, CoCoRaHS observers can share weekly Condition Monitoring Reports that describe on-the-ground impacts to validate our statewide drought assessments.

A graphic showing typical cool-season El Niño impacts in North America
El Niño’s typical cool-season impacts see a stronger jet stream that brings overall wetter conditions across the southern US. (NASA Earth Observatory illustration by Joshua Stevens, modified by Michala Garrison)

The Bottom Line

April is shaping up as a month for the record books for all the wrong reasons, currently on pace to be the warmest April on record in Asheville, Charlotte, and Raleigh, and one of the top-ten driest as well, with less than an inch of rain in most areas.

Simply put, without rain soon, our current trajectory will continue to see expanding Extreme Drought and perhaps even the emergence of Exceptional Drought, as depicted by the 120-day Standardized Precipitation Index — one of our most useful drought indicators that puts recent rainfall amounts in the framework of historical percentiles, per the US Drought Monitor approach.

Any rain would help slow the degradation, and a few wetter months as CPC hints at this summer could begin to alleviate the impacts. Of course, ongoing dryness through the summer would continue the recent trend of drought expansion, and that would make our cool-season deficits the sort of head start that we didn’t get back in 2007.

A map of the 120-day Standardized Precipitation Index in North Carolina
The 120-day Standardized Precipitation Index may preview upcoming drought expansion without a decent dose of rainfall soon. (Map from the SRCC Integrated Water Portal)

Thankfully, we’re not facing those 2007-level impacts just yet, again thanks to the different timing of each drought’s development. The emerging El Niño is also a light at the end of the tunnel — albeit a distant one — that we didn’t have in 2007, which ended with a dry La Niña winter that caused Exceptional Drought to linger into 2008.

If and when a wetter pattern emerges this year, it will take several months of consistently above-normal precipitation to make a major dent in our current deficits. With drought likely here for the long haul, it will take all of us to manage the impacts using best practices and lessons from past droughts.

That includes following guidance regarding water usage and burn bans, being aware of where our water comes from and how we’re using it in our own households, and being prepared to absorb the letdown of brown lawns and stunted gardens for a few months.

While this drought persists, you can check your local drought status on the NC DMAC website, track fire danger forecasts on our public-facing map, sign up to receive our weekly update infographics by email, and subscribe to our Climate Blog to receive the latest weather news.

Categories
Weather

El Niño Looms Large Over This Hurricane Season

Big changes will be happening in the global atmosphere this summer, which could turn the tropical Atlantic from a hotbed into a ghost town, while also setting the stage for better rain chances locally by the end of the year.

To break down what may happen during this hurricane season and beyond, we’re taking a closer look at the current environmental conditions, the latest outlooks, the potential progression of activity, and the implications for North Carolina.

Tale of the Tape

This hurricane season could come down to a tug of war between two environmental heavyweights: warm water in the Atlantic Ocean versus an emerging El Niño in the Pacific.

For the fifth year in a row, sea surface temperatures in the Atlantic’s main development region – which spans from the west coast of Africa into the Caribbean Sea – are warmer than normal entering the summer.

At this point, there is a pronounced gradient across the basin, with eastern areas seeing near-normal temperatures, while it’s much warmer farther west, including in the Caribbean and Gulf.

Even if that warm water, which is favorable for storm formation, lasts throughout the season, that doesn’t mean it will be an active one from start to finish. That’s because of the other main player in the tropics this year: a developing El Niño pattern.

We’re already seeing the telltale warming off the coast of South America associated with El Niño, and as that warmer-than-normal water spreads westward across the equatorial Pacific Ocean, it will begin to have atmospheric impacts.

A map of sea surface temperature anomalies as of May 20, 2026
Sea surface temperature anomalies as of May 20 show warm water across the western Atlantic and eastern Pacific Ocean. (Map from NOAA Coral Reef Watch)

Those include a strengthening of the upper-level winds that blow across the tropical Atlantic, which creates damaging wind shear that hinders storm formation.

The Climate Prediction Center’s latest ENSO alert from last week noted that sea surface temperatures in the central Pacific are already 0.4°C above normal, which is just shy of the El Niño threshold of +0.5°C.

That could make this an early blooming El Niño by historical standards, perhaps on par with the timing of the record-setting 1997 event.

That early emergence, along with the amount of sub-surface warmth in the Pacific, has inspired headlines about a potential “super El Niño”, but it’s important to note that there’s still a lot of uncertainty about the eventual strength of this event.

The latest forecasts show a roughly equal chance of a moderate, strong, or very strong El Niño by next winter. A very strong event – with sea surface temperatures at least 2.0°C above normal – would put it on par with the strongest El Niños on record in 1997-98 and 2015-16, but that’s far from a guarantee.

A graph of forecasted ENSO strength probabilities through next winter
Forecasted ENSO strength probabilities show near equal chances of a moderate, strong, or very strong El Niño by next winter (DJF). (Graph from the NWS Climate Prediction Center)

This Season’s Outlooks

Earlier today, NOAA released its hurricane season outlook for 2026. It’s calling for below normal activity overall, with 8 to 14 named storms (the 30-year average is 14.4), 3 to 6 hurricanes (the average is 7.2), and 1 to 3 major hurricanes (the average is 3.2).

NOAA’s outlook notes the warm water in place across the Atlantic, as well as the developing El Niño, but the degree to which each one will shape the season is still up in the air.

“Although El Niño’s impact in the Atlantic Basin can often suppress hurricane development, there is still uncertainty in how each season will unfold,” said NOAA’s National Weather Service Director Ken Graham.

Other forecast groups have released their own outlooks this spring. The veteran team at Colorado State University is predicting slightly below normal activity, with 13 named storms, 6 hurricanes, and 2 major hurricanes.

They expect a moderate to strong El Niño in place by the peak of the season this fall, with that El Niño and its increased wind shear in the Atlantic being the dominant factor in this hurricane season.

A graphic showing NOAA's Atlantic hurricane season outlook for 2026
NOAA’s hurricane season outlook for 2026 predicts below-normal activity in the tropical Atlantic. (Image from NOAA)

NC State’s forecast team, led by Dr. Lian Xie, uses a statistical approach based on historical years with similar environmental conditions as this one. Their outlook calls for near to slightly below normal activity this year, with 12 to 15 named storms, 6 to 9 hurricanes, and 2 to 3 major hurricanes.

While predicting hurricane landfalls this far in advance is trickier and often at the whims of where local weather patterns like high pressure systems set up throughout the season, some outlooks do hint at where we may see more activity.

After no hurricanes made landfall in the mainland United States in 2025, the Colorado State team predicts a 32% chance of a major hurricane making landfall in the US this year, which is lower than the historical average of 43%.

The NC State team calls for two to five named storms forming in the Gulf, which is near normal, and one to three named storms in the Caribbean, which is slightly below normal. Last year, only one storm – Hurricane Melissa – developed in the Caribbean due to high wind shear across that region for most of the season.

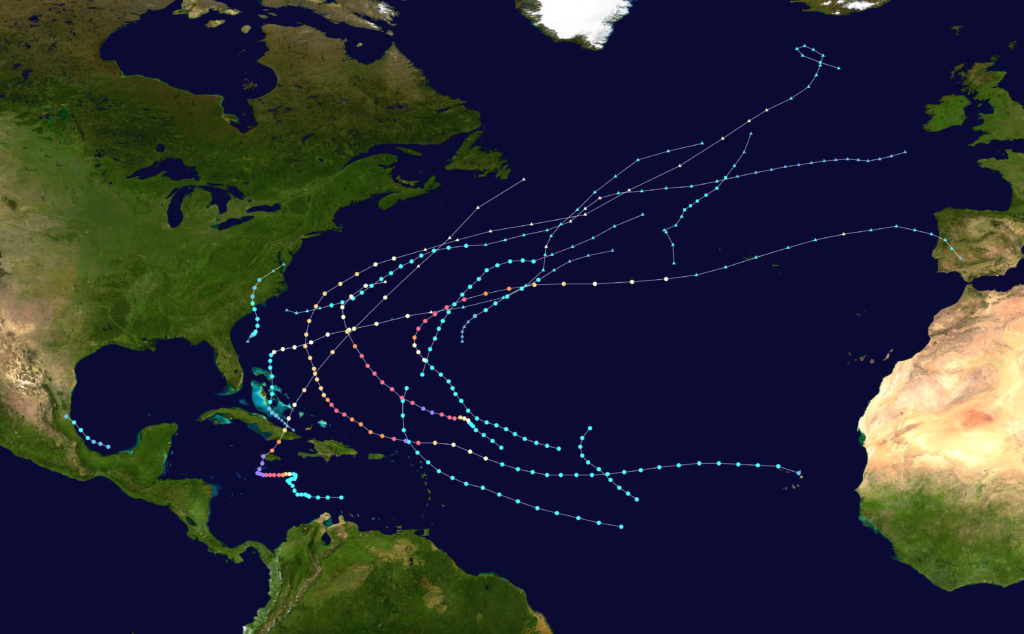
A map of tropical storm tracks in the Atlantic Ocean in 2025
Last year saw near-normal activity overall in the Atlantic, but just one storm in the Caribbean and no landfalling hurricanes in the mainland US. (Public domain image)

Possible Seasonal Progression

This hurricane season could be split into two distinct halves, with the first being more active and the second quieter as the El Niño pattern takes hold.

While conditions aren’t the most favorable for storm formation now in May – basin-wide wind shear is high at the moment – that should subside as we head into summer, and the warm water could then become a driving factor for storm formation.

As of May 20, average sea surface temperatures in the main development region are 0.27°C above the 30-year average. While that’s nowhere near the record warm sea surface temperatures in the spring of 2024, the Atlantic is now at a similar level of warmth as at this point last year.

We saw a flurry of early season activity in 2025, with three named storms including Chantal forming before the middle of July. Based on that, we could see another fairly fast start to this hurricane season.

A graph of recent and historical sea surface temperatures in the Atlantic main development region
Sea surface temperatures in the Atlantic’s main development region in 2026 (red line), 2025 (orange line), the 1991 to 2020 average (black dashed line), and other historical years (gray lines). (Graph from Climate Reanalyzer based on NOAA OISST data)

But once El Niño’s atmospheric impacts kick in, that could cause an abrupt reduction in Atlantic activity. In both 1997 and 2015, when strong El Niños had emerged by late summer, only two named storms formed after the third week of September.

It’s worth noting that one of those storms in 2015 had a big – if indirect – impact, as moisture from the fringes of Hurricane Joaquin fed an upper-level low pressure system that produced heavy rain in parts of the Carolinas.

So tropical impacts may still be possible late in this hurricane season, but the odds are lower due to that El Niño-induced wind shear. We see that reflected in historical hurricane tracks along our coastline.

In 50 previous ENSO-neutral and La Niña years, 59 named storms passed within 100 miles of Wilmington, for an average of 1.18 per year. In El Niño years, that rate is cut in half to just 0.58 storms per year, on average, with 15 named storms in 26 years.

A map of named storms passing within 100 miles of Wilmington during past ENSO-neutral and La Niña years
A map of named storms passing within 100 miles of Wilmington during past El Niño years
A comparison of named storms passing within 100 miles of Wilmington in ENSO-neutral or La Niña years (left) and El Niño years (left) since 1950. (Maps from NOAA’s Historical Hurricane Tracks)

What’s at Stake for Our State

The current drought began in part due to a lack of tropical impacts last fall, and it could get worse if we miss out on that tropical contribution to our rainfall again this year.

Wilmington averages more than eight inches of precipitation in both August and September, and past research at our office found that some coastal areas receive up to 20% of their warm-season precipitation from tropical systems. That’s a big chunk of rain to miss out on if the tropics don’t deliver.

An active start to the hurricane season could be our best chance to see solid rainfall. In June, July, and August, the Carolina coast is one of the preferred areas for tropical storm formation thanks to the warm waters of the Gulf Stream and the tendency of stalled cold fronts offshore to become tropical, as Chantal did last year.

If storms stay away from our coastline again this year, then it would also continue a notable streak. It has been almost six years – dating back to Isaias in August 2020 – since the last storm made landfall at hurricane strength in North Carolina. That’s our longest streak without a landfalling hurricane since the nearly eight-year gap between Isabel in 2003 and Irene in 2011.

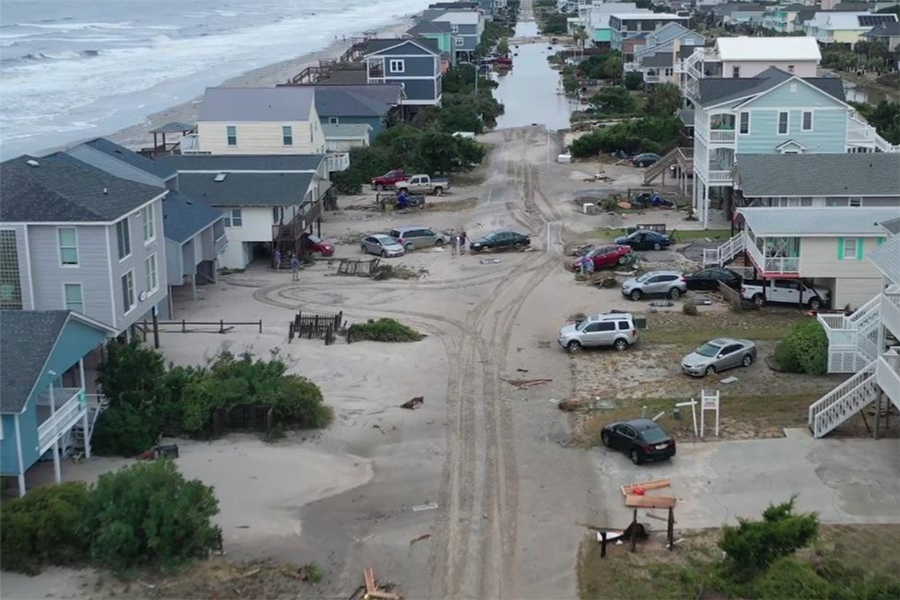
A photo of flooding and overwash on Oak Island after Hurricane Isaias
Flooding and overwash on Oak Island after Hurricane Isaias hit in 2020. (Photo courtesy of Oak-IslandNC.com)

Of course, we haven’t been totally shielded from tropical impacts in recent years. Since 2020, the Mountains have been devastated by remnant storms including Fred and Helene, the Piedmont has seen heavy rain and flooding from Chantal and Debby, and coastal areas have sustained soakings from the likes of Ian, Ophelia, and the unnamed Potential Tropical Cyclone Eight.

But hurricanes do tend to bring amplified impacts, including high winds and storm surge, and prompt evacuations like coastal areas haven’t seen on a widespread scale since Florence in 2018.

While a stronger El Niño emerging this summer could shut down tropical activity sooner, that could also be a promising sign for better rainfall later this year. As we enter our cool season in the fall and winter, a stronger jet stream should bring more moisture-rich weather systems in from the Gulf or along our coastline.

In both 1997 and 2015, the summer was dry – including our driest August on record in 1997. After that, wetter conditions began by the fall, including the 6th-wettest October and 2nd-wettest November on record in 2015. And with strong El Niño patterns in place, we then had our state’s wettest winter on record in 1997-98, and the wettest December on record in 2015.

In summary, El Niño has the potential to reduce tropical impacts by late summer but ramp up our rain chances by the end of the year. That means a lot is riding on this pattern, from the evolution of hurricane season to the future of our drought.

Categories
Weather

Here’s what we know about the climate cost of white trails aircraft leave in the sky

Nicolas Bellouin, University of Reading

Contrails, short for condensation trails, are the white streaks often seen in the sky behind aircraft. The international cloud atlas, which classifies clouds, has a category just for them: cirrus homogenitus, an example of man-made clouds.

Contrails contribute to climate change, adding to the warming by the carbon dioxide emitted by aviation. Although the exact amount of warming caused by these wispy-looking clouds is uncertain, what is understood now suggests that reducing the number of contrails has the potential to reduce the climate impact of flights.

Contrails are made of ice crystals. These reflect sunlight, causing the Earth’s surface to receive less energy, but at the same time trapping some of Earth’s outgoing infrared radiation. Depending on the balance between those two opposite effects, a net loss of energy or a gain of energy, individual contrails can be either warming or cooling over their lifetime, but warming dominates once averaged over the global, annual contrail population.

How are they made?

Contrails form behind aircraft at around an altitude of 10-11km. They only form in sufficiently cold and humid regions of the atmosphere, where water vapour condenses on to the soot particles emitted by aircraft engines to form liquid droplets, which freeze into ice crystals. The regions with the most contrails are over Europe, the North Atlantic, and eastern North America. They are rarer in Asia.

Soot particles are needed to form contrails, yet even engines that emit very few soot particles still generate contrails. Other particles, often formed in the engine plume, take over and lead to contrail formation. But some combinations of fuel and engine technology may yet provide a way to form fewer contrails, or at least contrails with a smaller climate impact.

The characteristics of a contrail depend initially on the size, shape and engine position of the aircraft that created it, but atmospheric conditions are ultimately more important.

In a dry atmosphere, contrails only last a few minutes and cover a tiny surface area: their climate impact is negligible. But if the atmosphere remains cold and moist enough, many contrails form, grow, and come together to form fields of ice clouds, called contrail cirrus.

Contrail cirrus impact the climate because they last for several hours and can cover large areas, sometimes spanning entire countries, as has been observed over the UK and France, for example.


Aircraft in flight with contrails
Contrails from aircraft form in colder temperatures.
Photo by Sander van der Wel, licensed CC BY-SA 2.0 via Wikimedia Commons.

Some contrail cirrus clouds can exert the same climate impact as tens, even hundreds, of tons of carbon dioxide.

Two effects make contrails particularly potent. Although they initially form from the few hundred kilograms of water vapour and the
dozens of grams of soot released every minute of flight, contrails then gain mass from the humidity of the atmosphere. Also, ice crystals absorb infrared radiation at virtually all wavelengths, while carbon dioxide only absorbs in narrow wavelength ranges.

However, contrail cirrus strongly affect the flow of energy in and out of the Earth for a few hours. This is in contrast to the comparatively weaker changes caused by carbon dioxide, which last for centuries. So the warming caused by a flight will initially be dominated by contrails, but carbon dioxide will dominate a few years after the flight.

Routing aircraft to avoid flying in the regions where contrails form may slow down the climate warming caused by a growing aviation sector. But there are still many things scientists need to understand about how to predict which flights would see their climate impact reduced the most using this kind of planning.

Weather forecasts of humidity at flight altitude need to improve, and one way to do so is to have more accurate and more frequent measurements of humidity. This is the aim of the Mist research project, where I work with Honeywell Aerospace UK and Boeing UK to develop a humidity sensor to detect contrail formation, see how the sensor can be integrated on commercial aircraft, and evaluate how better humidity measurements affect the predicted climate impact of contrails.

Many research projects are seeking to better quantify the climate impact of contrails and find ways to form fewer warming contrails. Changing fuel or engine technology is slow. But optimising flight trajectories with weather forecasts to avoid the cold, moist regions of the atmosphere where contrails form might be achievable more quickly.The Conversation

Nicolas Bellouin, Professor of Climate Processes, University of Reading

This article is republished from The Conversation under a Creative Commons license. Read the original article.

Categories
Weather

A Century-Old Drought Offers Parallels to Today

As we remain mired in our worst statewide drought in more than 18 years, comparisons with historical droughts — especially that memorable 2007-08 event — have become common in recent weeks, including in our own assessment of the current drought and its impacts.

We’ve generally labeled the 2007-08 drought as the worst in North Carolina’s modern history, but by some metrics, another drought from a century ago could also stake claim to that title.

During that event, drought gripped much of the state in 1925 and 1926, leaving water supplies running short and farms on the brink of failure. In that sense, it was North Carolina’s own Dust Bowl a decade before drought devastated the central US.

In this lookback, we’ll explore the emergence, intensification, and persistence of the 1925-26 drought, as well as its intensity, the changes to water supplies it informed, and takeaways for our current drought event.

Drought Takes Root in 1925

Few realized it at the outset of the 2007 drought, but that event would follow a remarkably similar trajectory as in 1925.

Both droughts first emerged in western North Carolina, with records from the Southern Power Company tracing the beginning of the dry spell back to February 1925. That meant the newly completed Rhodhiss Reservoir near Hickory didn’t have a chance to fill up, or meet its potential as an auxiliary power supply, before drought descended on the region.

As the growing season got underway during the state’s 6th-driest spring on record, impacts to agriculture became apparent. By June, the western hay crop had already been reduced by three-quarters, the tobacco in Greensboro and Madison was in bad shape, and there were no fresh vegetables at the market in Mooresville.

With few major reservoirs constructed at that time and most areas drawing water from rivers or groundwater wells, concerns about water shortages and insufficient power generation arose early that summer.

A photo of Rhodhiss Dam in 1926
Rhodhiss Dam, seen here in 1926 shortly after its opening, struggled to impound much water early in the 1925 drought. (Photo courtesy Duke Energy)

As in 2007, the drought degraded to critical levels during one particularly hot, dry summer month. In 2007, that was August. In 1925, that happened in July, which still stands as the 7th-driest July on record statewide, and the driest for western areas like Statesville, which had only 0.28 inches of rain all month.

That meant cities like Mount Airy implemented outdoor watering restrictions while the town of East Bend prepared to deepen its well that had dried up. The flow on some mountain streams became insufficient for power generation, forcing Franklin to turn off its street lights at night.

While eastern areas, which weren’t hit as hard by the drought in the summer of 1925, enjoyed a bumper crop of tobacco, the same wasn’t true farther west. As one article noted, “gloom now rests heavier on all tillers in this vicinity.”

Crop losses in July totaled more than $10 million – or more than $186 million today, adjusted for inflation – including $9.288 million to tobacco alone, with a loss of 36 million pounds.

A photo of workers on a tobacco farm in Wilson County, NC
Workers on a tobacco farm in Wilson County – an area that didn’t have as severe of a drought – circa 1926. (Photo from the North Carolina Collection Photographic Archives)

Summer Severity

At the time, it was claimed that “[t]he drought and heat that have prevailed this summer do not have a parallel in all history.” Indeed, that was the 2nd-warmest and overall driest summer on record through that point in our state’s recordkeeping, although the summer of 1925 has now slipped to the 21st-warmest and 6th-driest on record.

By August, our mountain landscape began to ignite, most prominently with a large wildfire on Grandfather Mountain. Similar to the statewide burn ban implemented in August 2007, and in late March of this year, there were consequences in 1925 as well: a hefty $50 fine (the equivalent of more than $900 today) was levied on anyone caught starting a fire outdoors.

And like in 2007, when water restrictions became widespread during the fall, conservation measures were tightened by September of 1925. That month, the drought was amplified by record high temperatures in Charlotte and the latest 100-degree day on record in Greensboro.

A postcard showing an illustration of downtown Charlotte circa 1925
A postcard depicting downtown Charlotte along Tryon Street circa 1925. (Image from Georgia Treasures)

In order to preserve enough water for hydroelectric production along their streams, the Southern Power Company asked 300 textile mills to stop running – initially one day per week, then bumped up to two days, and eventually two and a half.

So dire was the water shortage in 1925 that Asheboro began bringing in trainloads of water from High Point to meet even conservative demands, and in the Mountains, “springs from which families have drawn their water for generations are dried up.” Southern governors sought help from the divine – in 1925, as in 2007.

Despite slightly wetter-than-normal conditions in October and November, 1925 finished as our 5th-driest year on record statewide, and the driest on record for much of western North Carolina, including Morganton, Brevard, and Cullowhee – each of which was more than 20 inches below their average annual precipitation. For that reason, it was called “the year of the great drought” for the Mountains and Piedmont.

A photo of the Tar Heel Mica Plant along the North Toe River in 1925
The North Toe River and Tar Heel Mica Plant in Plumtree, NC, circa 1925. (Photo from NC Digital Collection via Avery History Hunters)

Drought Roars Back in 1926

The winter of 1925-26 offered some reasons for hope, but also causes for concern that the drought wasn’t over yet. Parts of the state saw wetter weather in January, which we now recognize was a side effect of that winter’s El Niño event. However, that pattern set up unusually far to the east, which also seemed to shift its impacts eastward, bringing more rain to coastal areas while the southern Mountains stayed dry.

Entering the growing season, the Weather Bureau noted that the cool-season rainfall was “not enough to soak into the soil to any considerable depth,” and as dry weather returned that spring, even eastern Piedmont locales like Raleigh faced low water supplies.

The summer of 1926 wasn’t as hot or as dry as in 1925, but the crop prospects were “anything but encouraging.” The ongoing drought again affected tobacco and threatened the harvest of small grains, while the cotton could not advance in the west.

After a final resurgence of dryness that fall, including our 11th-driest September on record, heavy rains arrived by November and helped wind down the drought entering the next winter.

For farmers, though, the damage had been done, as drought was just one complicating factor in an overall challenging time during the 1920s. That period also saw the decline of World War I-era European demand for cotton and tobacco, and the emergence of the boll weevil pest that devastated the cotton crop. Facing those pressures, 16% of farms in South Carolina were abandoned by the end of the decade.

A photo of workers in a cotton field near Asheboro
Workers pick cotton in a field near Asheboro prior to the closure of the local mill in 1925. (Photo by George Russell courtesy Randolph History)

The 1925-26 Drought, In Context

Amid our current drought, you’re most likely to hear comparisons to the 2007-08 event, given its recency and severity. But if you listen closely, you may just see some 1925 references as well. For instance, Jefferson is off to its 4th-driest start to a year on record, but 1925 was more than an inch drier through this point in late April.

We can compare droughts from different eras using the Palmer Drought Severity Index and its family of related indicators, which use temperatures and precipitation to assess the moisture inbalance. For instance, the Palmer Z-Index shows that North Carolina’s driest two-year period since 1895 occurred in 2007-08, with 1925-26 not far behind.

And shifting that 24-month window to run from November to October, rather than January to December, the 1924-26 drought becomes slightly drier than the same period in 2006-08.

Since the US Drought Monitor didn’t begin officially tracking conditions until 2000, we can’t tell exactly how widespread Extreme or Exceptional Drought might have been back in 1925-26, but the Palmer indices can again offer a reasonable approximation.

A graph of the Palmer Z-Index over 24-month periods for North Carolina since 1895
The 24-month Palmer Z-Index since 1895 shows the 1925-26 drought at a similar level of dryness as the 2007-08 drought. (Data from NCEI Climate at a Glance)

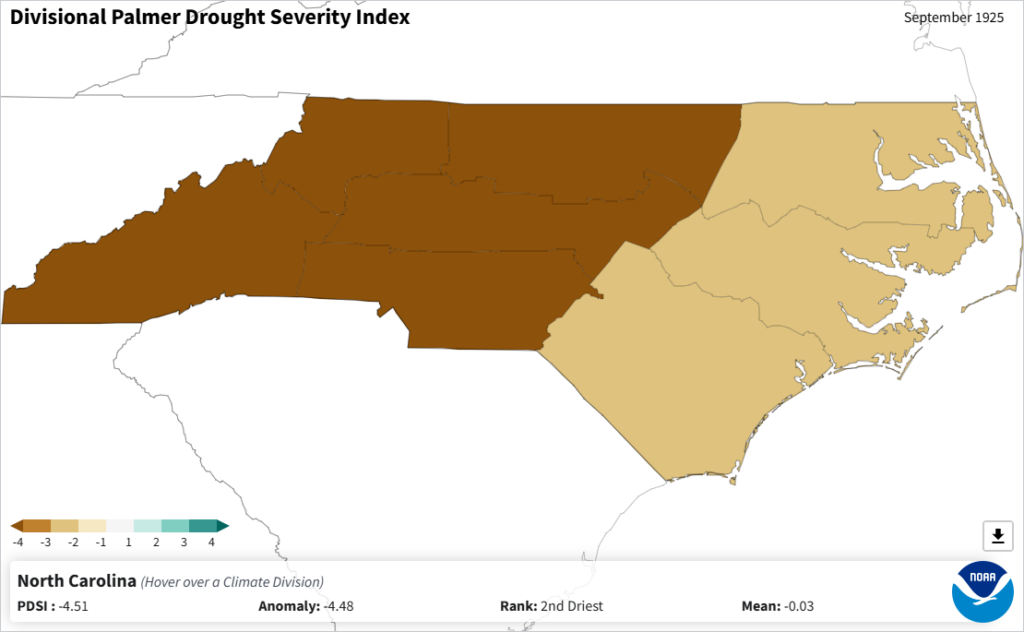
The Palmer Drought Severity Index reached its most extreme drought category in the southern Mountains by July 1925, with the southern Piedmont following in August, and the rest of the Mountains and Piedmont hitting that level in September.

Given that severity, as well as impacts like water shortages and failed crops, it’s fair to assume much of the state saw Exceptional Drought-level conditions in 1925. That would put its peak intensity on par with the 2007 drought, with perhaps slightly less coverage across the Coastal Plain.

We can also quantify each drought’s longevity using statewide precipitation deficits. In 1925, we stacked up eight consecutive drier-than-normal months statewide between February and September, then another seven in a row from April to October 1926.

The 2007 drought began with 10 consecutive dry months from December 2006 to September 2007. In our current drought, April is set to be our eighth dry month in a row since last September.

A map of the Palmer Drought Severity Index in September 1925
The Palmer Drought Severity Index showed the most severe category in the Mountains and Piedmont of North Carolina by September 1925. (Map from NCEI Climate at a Glance)

Worries About Water

In the aftermath of the 1925-26 drought, attention turned to bolstering our water supplies, given their usage in hydroelectric generation, industry, and drinking water.

“The shortage of water all over the state during the summer indicates the imperative need of taking a more serious look at the water supply problem,” stated one editorial column from December 1926.

A University of North Carolina Newsletter likewise put forward that “the best, and generally the cheapest, method of ensuring an adequate supply of power at all times is to provide for storage of some of the surplus flow of wet periods to be used in time of drought.”

That kick-started a boom of new reservoir construction over the next half century. High Rock Lake, which supported Alcoa’s aluminum smelting plant, was filled in 1928. The New Deal-era Tennessee Valley Authority created several western reservoirs including Fontana Lake, which was finished in 1944.

A photo of Fontana Dam in western North Carolina in 1952
Fontana Dam, seen here at night in 1952, is the tallest dam in the eastern US at 480 feet. (Photo from the North Carolina State Archives)

Lake Norman was the last, and largest, of Duke Energy’s manmade lakes along the Catawba River to be completed in the early 1960s, and Falls Lake near Raleigh was constructed in the late 1970s.

That increased capacity for water storage has boosted our supply and added a measure of drought resilience, but demands have also increased over time. North Carolina’s population has almost quadrupled in the past century, with more people packed into cities and pulling from the same water sources.

That’s why we can still see water restrictions during long-lasting or extreme droughts like the current one, and why frustrations about how water is used happen now as much as they did back then.

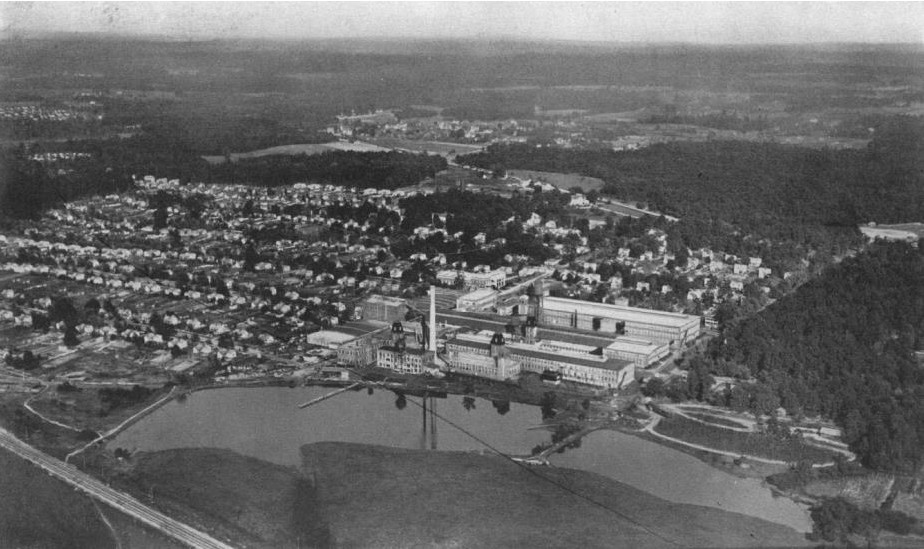
A photo of Proximity Mills in Greensboro circa 1925
Proximity Mills, a textile mill in Greensboro, and the adjoining worker’s village are seen here circa 1925. (Public domain photo courtesy of Hathi Trust Digital Library)

Lessons Learned, Then and Now

Our drought from 100 years ago can offer a few other lessons for modern-day North Carolina. For one, we see the folly of prematurely proclaiming the end of the drought. In Boone that June, in Concord in September, and statewide the following summer, the drought was declared broken after one or two rain events, only for its impacts to re-intensify in the months that followed.

That’s a reminder that drought is not just skin-deep, and facing double-digit rainfall deficits, it will take more than one event, or even one wet month, to fully recharge our lakes, soil moisture reserves, and groundwater stores.

We also see the importance of timing, and how hot, dry weather in the summer can be much more impactful than a few dry months over the winter. The 1925 and 2007 droughts both ramped up amid intense summer dry spells, and several weeks of hot, dry weather this spring have driven the emergence of Exceptional Drought in the southern Piedmont this week.

Graphs of monthly statewide precipitation departures from average in 1925 and 1926
Monthly statewide precipitation departures from the 1901-2000 average in 1925 and 1926. (Data from NCEI Climate at a Glance)

We often think about hurricanes as the best cure for a drought, but that wasn’t the case in either 1925-26 or in 2007-08 — and we can’t count on one this year, either. The most significant tropical system of 1926 – the Great Nassau Hurricane – brought only light and scattered rain to North Carolina, and the 2008 drought improved with better springtime rainfall.

It’s too early to tell whether the 2025-26 drought will eventually end up in the conversation as the worst on record for our state, but if it does, then it will have gotten there from a very different trajectory – initially emerging mostly in our cooler months – than the droughts of 1925-26 and 2007-08.

But with many common impacts and stresses across those three events, it’s clear that while the pathways into drought can differ, the need for awareness, conservation, and long-term planning holds just as true today as it did a hundred years ago.

Categories
Weather

An Anomalous April Was Hot and Dry with Deepening Drought

Periods of summer-like heat and limited rainfall combined to cause drought intensification last month, which has led to new emerging impacts across the state.

Untimely Temperatures

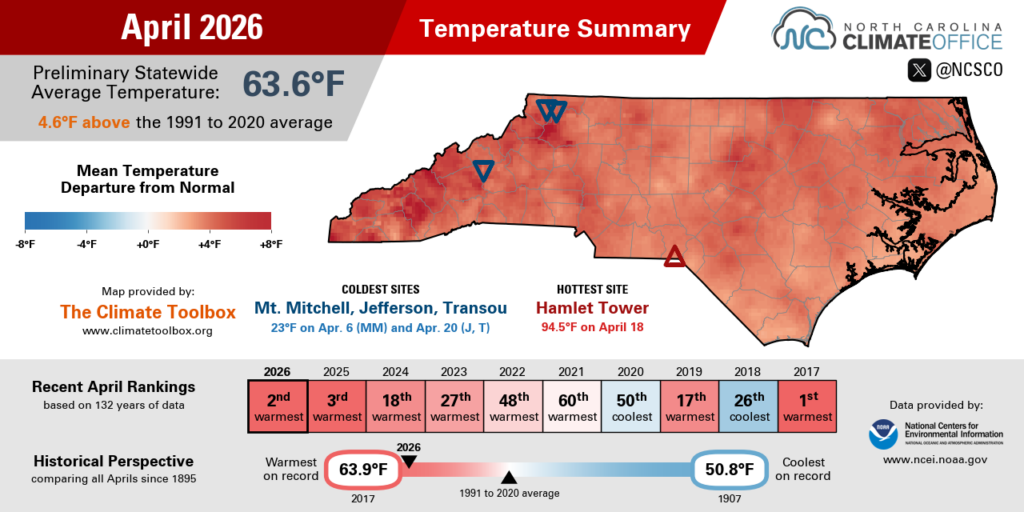
Several long stretches of unseasonable temperatures boosted this to one of our warmest Aprils on record. Based on preliminary data from the National Centers for Environmental Information (NCEI), last month’s statewide average temperature was 63.6°F, which ranks as our 2nd-warmest April since 1895.

That slotted in just ahead of last April, which also saw an early emergence of summer-like temperatures, and ranked behind only April 2017, which was warm but wet.

This April did finish as the warmest at a few stations. Both Hickory and Lincolnton recorded their warmest April dating back to the mid-20th century, while Greensboro tied 2017 for its warmest April on record.

Elsewhere, it was the 2nd-warmest April on record in Charlotte, the 3rd-warmest in Asheville and Raleigh, and the 5th-warmest for Fayetteville and Hatteras.

On the heels of our state’s 4th-warmest March on record, last month began with more 80-degree days – high temperatures more typical of early June than early April. Our weather pattern closely resembled the summer as well, with high pressure parked just off our coastline.

The April 2026 temperature summary infographic, highlighting the monthly average temperature, departure from normal, and comparison to historical and recent years
The April 2026 temperature summary for North Carolina.

That warmth was briefly interrupted by crashing temperatures behind a cold front on April 8. The following morning, lows dropped below freezing in parts of the Piedmont. Raleigh’s low of 32°F on April 9 represented its latest spring freeze in five years, since April 23, 2021.

That chill was short-lived, though, as the return of high pressure across our region sent temperatures climbing well into the 90s by mid-month. On April 15, downtown Asheville hit 90°F, which was the first 90-degree day ever observed in April at that location.

On April 17, Marion logged its earliest 90-degree day since 2006, and our Sandhills ECONet stations in Hamlet and Lilesville each hit 94°F on April 18 in the warmest April readings on record at both sites.

By the end of the month, Raleigh had logged 12 days with temperatures at or above 85°F. That passed the 11 days last year for the most of any April. In Charlotte, the 10 days hitting 85°F or greater last month also set a new record for April, surpassing the 9 days that hot in 1925 – which, as we recently documented, was when one of our state’s worst droughts began to develop.

A photo of Whiteside Mountain silhouetted in front of the sunrise
A view of Whiteside Mountain at sunrise on April 10. (Webcam image courtesy Meghan Danahey)

Dry Weather Dominates

Put simply, this April was bone dry across most of the state. Per NCEI, the preliminary statewide average precipitation was only 1.31 inches, ranking as our 5th-driest April in the past 132 years, and the driest since 1995.

In a month renowned for its showers, much of the Piedmont received less than an inch of rain in total this April. Greensboro had just 0.58 inches, Raleigh received 0.82 inches, and Charlotte managed 0.83 inches in the 5th-driest April on record at all three sites.

Wilmington also fell short of the one-inch mark with only 0.94 inches in its 20th-driest April on record. Other coastal areas fared slightly better thanks to rain showers during the final weekend of the month. However, even after almost two inches on a single Sunday, Newport still finished April with less than three inches in total, and a drier-than-normal month overall.

In between the light showers early and late in the month, sites including Charlotte, Raleigh, and Wilson each went 19 days in a row from April 6 to 24 with no measurable rainfall. That was Raleigh’s longest springtime rain-free stretch since May 2010.

The April 2026 precipitation summary infographic, highlighting the monthly average temperature, departure from normal, and comparison to historical and recent years
The April 2026 precipitation summary for North Carolina.

Most of the Piedmont has now gone 48 days, or almost seven weeks, since their last half-inch rain event. That lack of significant rain since mid-March is a big reason why the statewide burn ban remains in effect.

Western areas ended April in slightly better shape after up to an inch of rain on April 28, but it was still an overall dry month in those areas. With 1.87 inches, Asheville had less than half of its normal rainfall in its 29th-driest April on record, and Murphy had only 2.43 inches in its 7th-driest April.

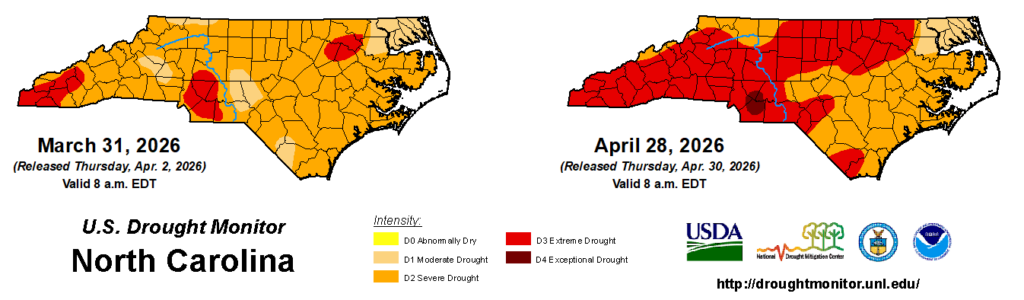
With such widespread dryness, almost 54% of North Carolina was in at least Extreme Drought (D3) and more than 95% was in at least Severe Drought (D2) by the end of the month. That remains the greatest coverage of those conditions since 2008.

A pocket of Exceptional Drought (D4) even emerged in the southern Piedmont, which has been the epicenter of dryness in recent months, with only 1.34 inches in Monroe since March 1 in its driest start to spring in the past 130 years.

A comparison of drought maps from March 31, 2026, and April 28, 2026, in North Carolina
US Drought Monitor maps from March 31, 2026, (left) and April 28, 2026, (right) for North Carolina.

Exploring More Drought Impacts

In our webinar and summary post a few weeks ago, we covered how this drought has affected water resources and fire danger. But there are plenty of other impacts to note that emphasize the severity and long-term nature of this drought event.

Groundwater levels began declining last fall, and after a lackluster recovery this winter, they’re trending down again already this spring. Since dropping below normal last October, the Grantham well (depicted below) in Wayne County struggled to improve over the cool season and saw a big drop-off in April as rain remained elusive.

Reservoirs have also felt the squeeze from limited incoming moisture and increased evaporation rates. In the Catawba-Wateree basin, Lake Norman ended April more than three feet below its normal target.

Those low levels, combined with other triggers such as streamflows, have pushed the basin into Stage 2 of its Low Inflow Protocol as of May 1, which has prompted mandatory water restrictions, including for Charlotte beginning on May 15.

A graph of groundwater levels at the Grantham well in Wayne County since January 2025
Groundwater levels at the Grantham well compared to normal conditions since January 2025. (Graph from USGS)

Farmers have been feeling the effects of this drought since the fall, when some late-planted crops like soybeans and cotton missed out on rainfall late in the growing season. That caused their quality to decline or forced farmers to wait longer until harvesting.

The lack of wintertime precipitation left hayfields and pastures struggling, and the recent dryness has 64% of pastures in poor or very poor condition, per last week’s USDA/NASS report.

For livestock producers who may not have a sufficient hay crop to feed their animals, the onset of Severe Drought made them eligible for monthly payments via the Livestock Forage Disaster Program – one way the US Drought Monitor is used to inform drought relief.

Although soil moisture levels have been lacking, planting has continued roughly at the average pace, including for corn, soybeans, and tobacco. That makes the next few weeks even more critical for farms to receive some rain to help those crops germinate.

A photo of a tractor kicking up dust in an eastern North Carolina field in April 2026
A dust cloud surrounds a tractor tilling a field between Smithfield and Goldsboro on April 4. (Photo by Scott Sharpe/News & Observer)

Even the northeastern corner of the state, which remains in only Moderate Drought (D1) thanks to more soaking rain events earlier this spring, hasn’t escaped the impacts of this drought.

Along the coastal interface between our freshwater rivers and saltwater sounds, droughts can push saltier water farther inland. One measure of that, the Coastal Salinity Index, has now reached the exceptional level on the Roanoke River near its junction with the Albemarle Sound.

The last time that stretch of the river was this salty for this long was in 2002 during another one of our state’s extreme and long-lasting drought events.

That salty water has had another unusual impact: last week, a Chowan County CoCoRaHS observer reported seeing porpoises swimming farther up the Sound than usual. Talk about an exceptional drought event!

Categories
Weather

Bowden Named SCO Director and State Climatologist

Atmospheric scientist Jared Bowden has been named director and state climatologist at the North Carolina State Climate Office (SCO), effective May 1. Bowden had been serving as interim director of the office since August 2025.

As director, Bowden leads one of the largest and most highly regarded state climate offices in the nation. The office, a UNC System Public Service Center that is part of the College of Sciences, serves all 100 counties in North Carolina and has a team of 10 full-time staff, plus support from graduate and undergraduate students.

SCO works to translate climate information into useful and usable knowledge, and bridges the gap between scientists, decision-makers and community members. The office’s work is aided by strong connections to climate-related units throughout campus and around the state, including the Department of Marine, Earth and Atmospheric Sciences, the Climate and Sustainability Academy, and the North Carolina Institute for Climate Studies. Bowden is the sixth permanent director of the office, which was established in 1976 and has been stationed at NC State since 1980.

Bowden’s research expertise is in the application of atmospheric models, especially improving the accuracy of regional climate models used to produce high-resolution climate change projections. He has developed these projections for various parts of the world including the contiguous U.S., parts of the Caribbean, and Africa. He is a co-author on the fourth and fifth National Climate Assessment as well as Puerto Rico’s State of the Climate Report. He has worked closely with scientists and practitioners in various disciplines, including hydrology, engineering, ecology, air quality and epidemiology. Bowden is also a skilled climate science communicator who shares information with media and community members about enhancing extreme weather recovery and resilience and adapting to climate variability and change.

Bowden joined the office as its associate director in 2024. He previously served as a senior research scholar in the Department of Applied Ecology at NC State and as a research assistant professor at UNC-Chapel Hill. He is also a former National Research Council postdoctoral researcher who worked closely with scientists at the U.S. Environmental Protection Agency.

Bowden is a three-time graduate of NC State, receiving his bachelor’s degrees in meteorology and marine sciences and his master’s degree and Ph.D. in atmospheric science. 

This post was originally published in College of Sciences News.

Categories
Weather

When Giants Rise: Exploring the Radiative Effect of Super-Coarse Dust

By Ginés Garnés Moraless, Doctoral Researcher working on Enhancing the Understanding of the Dust Direct Radiative Effect, originally posted on the Dust-DN Fellows Corner.

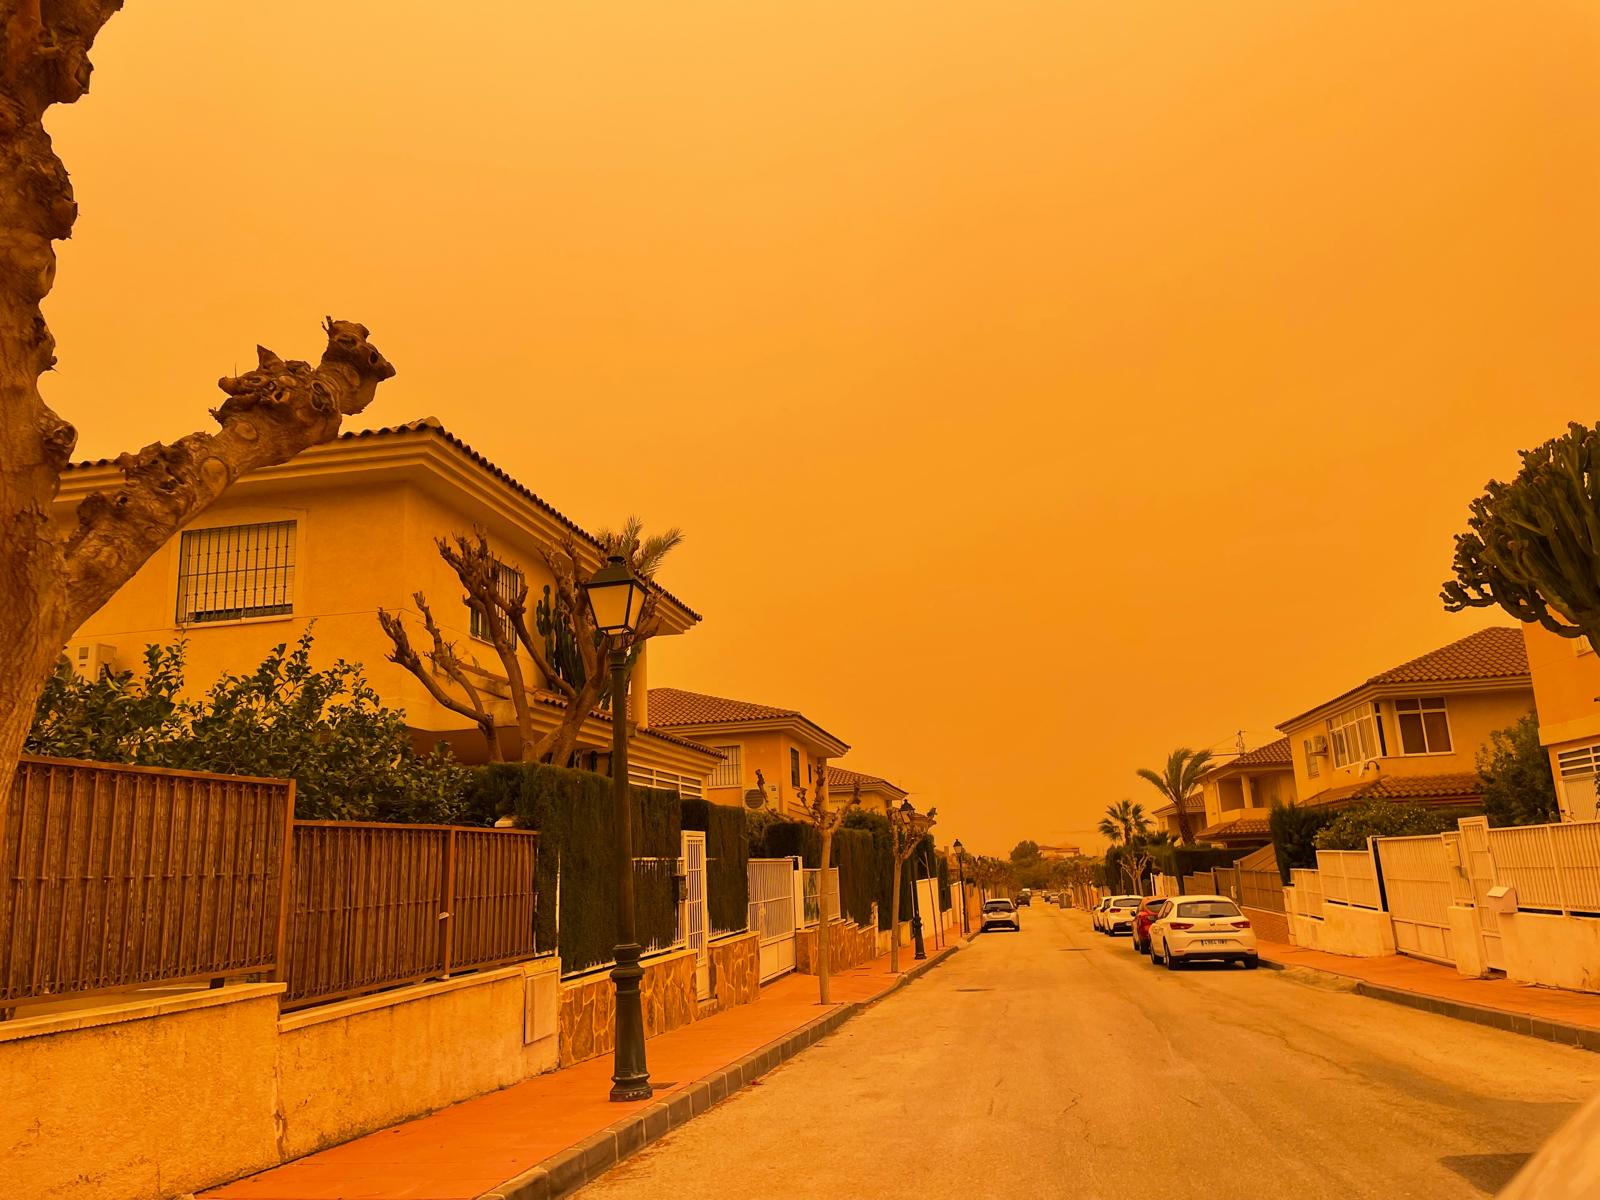
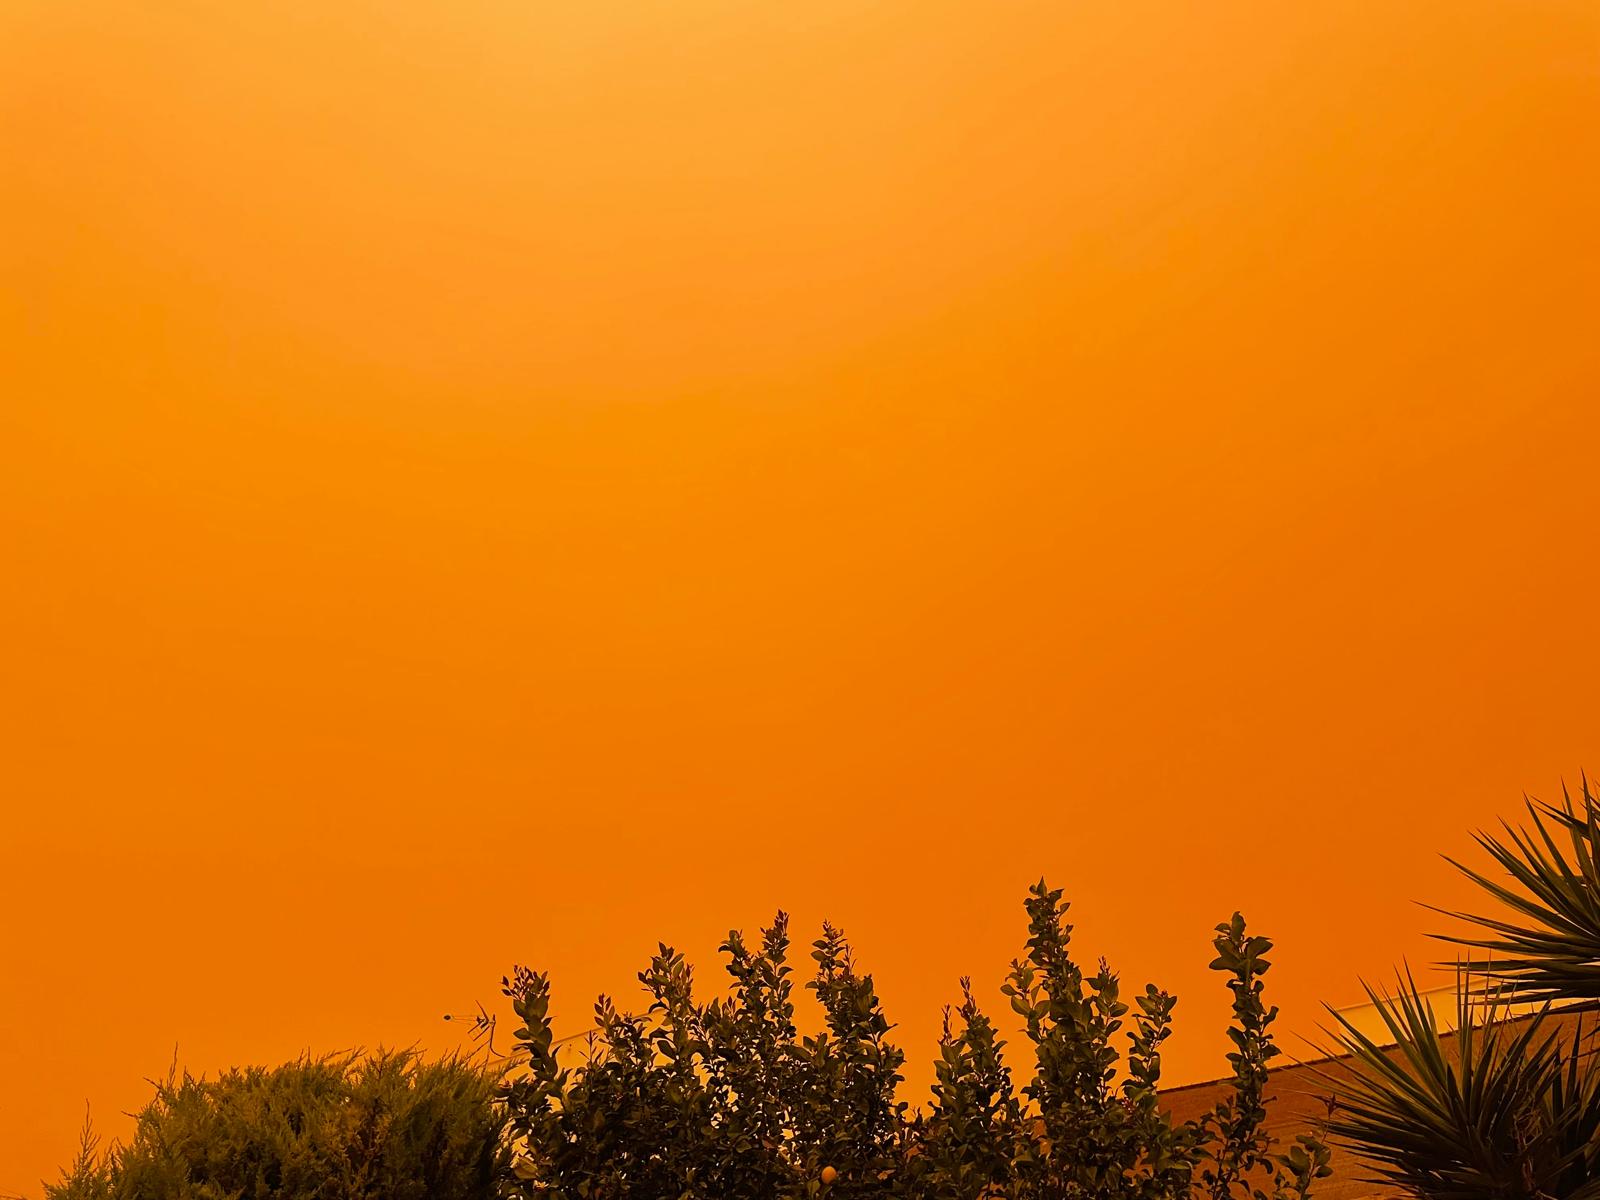
Originally from southeastern Spain, Saharan dust intrusions are a common phenomenon in my region. These episodes often lead to hazy skies, sometimes producing striking orange hues that make it feel as if you are on Mars (see Figure 1). Most people in my hometown (Murcia) do not exactly welcome dust with their arms wide open, as they can expect dust rain (more popularly called muddy rain) to come, with all surfaces getting dirty—car-washing runners may be quite happy with this, though. Moreover, extreme intrusions can pose health risks, especially to vulnerable populations or individuals with pre-existing respiratory conditions.

Murcia sky during the extreme dust event in March 2022

Fig. 1. Murcia’s sky during the extreme dust event in March 2022. Photos courtesy of Prof. Juan Pedro Montávez.
 

As a physicist with a Master’s degree in Meteorology, I find it quite exciting to analyse dust events from a scientific perspective. Not only do these particles affect visibility and air quality, but they also have a significant impact on weather and climate by altering cloud formation and the radiative balance. Solar radiation does not pass through the atmosphere passively, but interacts with particles, gases, and aerosols, including mineral dust, that are suspended within the atmosphere. These elements have direct radiative effects, including scattering and absorption processes, on both shortwave and longwave radiation. Despite their relatively small size, they play a crucial role in the Earth’s energy budget and, consequently, in the global climate. Recent studies have suggested that super-coarse dust—dust particles larger than 10 microns in diameter—are often overlooked, leading to uncertainties regarding the true direct radiative effects of dust. My PhD project aims to analyse the role of super-coarse dust in these dust-radiation interactions and to assess its influence on warming/cooling the planet.

During my first year as a Dust-DN doctoral candidate, I am based at the University of Reading, where I have been analysing data from the FAAM research aircraft dataset collected during the Fennec 2012 field campaign over the Sahara. This dataset offers the rare opportunity of having in-situ measurements of dust simultaneously with radiometric data, and therefore the opportunity of closing the radiative balance. So far, I have focused on the flights b708 and b709, which specifically targeted radiative processes. The top two panels in Figure 2 displays the total concentration of particles measured by a passive cavity aerosol spectrometer probe (PCASP) and a cloud droplet probe (CDP), respectively, along the three deep profiles the aircraft conducted in b708 (2 profiles) and b709 (1 profile). These two instruments cover different particle sizes, which allows us to know the amount of fine and coarse dust in the atmosphere. The bottom panel of Figure 2 illustrates the downwelling shortwave irradiance for the same three profiles. A visual inspection of these measurements and other results suggests that radiation shows a certain response to the presence of super-coarse dust, even though its concentration is much lower than that of fine dust. In the future, I plan to run radiative transfer models to properly quantify the impact of super-coarse dust on the radiative closure.

Fig. 2. Profiles of particle concentration (top two panels) and downwelling shortwave irradiance (bottom panel) during FAAM research flights b708 and b709 made during the Fennec 2012 field campaign over the Sahara.


Working with aircraft observations presents challenges due to the influence of both spatial and temporal variations in atmospheric conditions. In this context, having lidar data or satellite images is very useful for a more comprehensive understanding. I am looking forward to my secondment at the Cyprus Institute, where I will learn about the lidar technique and how to apply inversion algorithms to retrieve extinction coefficient profiles from raw lidar data (range-corrected signal). During my second and third years, I will be based in Évora, where I will focus on the modelling aspects of the research.

The Dust-DN project provides an ideal environment for my PhD, allowing me to learn state-of-the-art methods in dust research alongside motivated peers and prominent scientists in the field. I am eager to contribute to the scientific community, giving my best to provide new insights into the direct radiative effects of dust and its role in the climatic system.

Categories
Weather

Dog walking forecast 4.9.26 | News

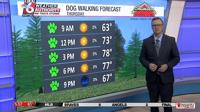
Good morning! We’re expecting another bright and sunny day, so it should be a great day to get out and get some steps in. The temperature is currently 63 degrees. 


Dog walking forecast 4.9.26


The afternoon high will be around 78 degrees, with sunny conditions lingering throughout the day. 

Warm weather will stick around for the next several days. Friday morning will begin in the mid 50s, with afternoon temperatures at almost 80 degrees throughout the region. 

Scattered showers are possible Friday evening. Slight rain chances will continue into the weekend, though precipitation is not expected to be significant. 


Dog walking forecast 4.9.26


Categories
Weather

Dog walking forecast 4.7.26 | News

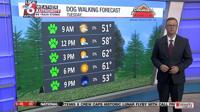
Happy Tuesday! It should be a great day to get some steps in with the pups! This morning is off to a calm and clear start with a current temperature of around 51 degrees.


Dog walking forecast 4.7.26


Afternoon highs are expected to be in the lower 60s. A few scattered clouds may be present, but conditions are expected to remain mostly sunny throughout the day. 


Dog walking forecast 4.7.26


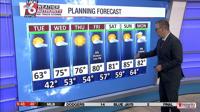
Temperatures will gradually warm heading toward the middle of the week. 


Dog walking forecast 4.7.26


Weather is expected to remain dry for the next several days, with a slight chance of showers on Friday evening. 

Categories
Weather

Dog walking forecast 4.1.26 | News

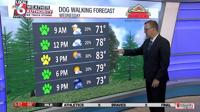
Good morning and happy Wednesday! It’s currently 71 degrees and with partly sunny conditions throughout the morning, it should be a good day to get those steps in. 


Dog walking forecast 4.1.26


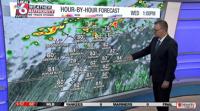
Pop up showers are not out of the question for southern Illinois this afternoon, but chances are slim. Afternoon temperatures are expected to reach 83 degrees. Wind gusts could reach 25 m.p.h. 


Dog walking forecast 4.1.26


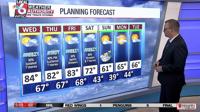
Thursday morning is expected to start out in the 60s, with a higher chance of isolated showers and thunderstorms in the afternoon. 

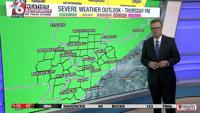
Stronger storms are possible Thursday evening, but are not predicted to be widespread. Wind gusts and slight hail are the main concerns with this system. 


Dog walking forecast 4.1.26


Rain totals continue to trend downward, with most of the area seeing less than an inch of rain by the weekend. 


Dog walking forecast 4.1.26