Power BI Use Cases | As leading companies realize, mere information management is not enough to manage data. This is why CEOs are moving towards data-driven decision-making to develop a data-oriented mindset. Data visualization comes with Business Intelligence tools that can assist in analyzing and interpreting volumes of data to facilitate real-time insights.
Microsoft Power Platform’s low-code tool, Power BI, is one such tool that you surely need to improve visual representations. Interactive dashboards make it easier to draw patterns and gain insights that inform major financial decisions.
As of 2024, more than 59,577 companies worldwide have adopted Microsoft Power BI as their Business Intelligence (BI) tool.
If you are thinking the Power BI is only for data analysts, you are far from reaping its benefits. With Power BI Development Services, it can be used by a product manager, HR manager, sales director, or even first-line executives. This tool can transform data into actionable insights that guide various industry situations. Managers can get answers to their impromptu questions based on their experience and develop visualizations that can be shared with others. Understanding data power can unlock unimaginable ways to derive value from data.
Clearly, Power BI is used under various business scenarios and across multiple industries due to democratized access and amazing quick insights.
This blog depicts diverse Power BI usage scenarios and how it drives business growth across multiple business verticals.
What is Power BI?
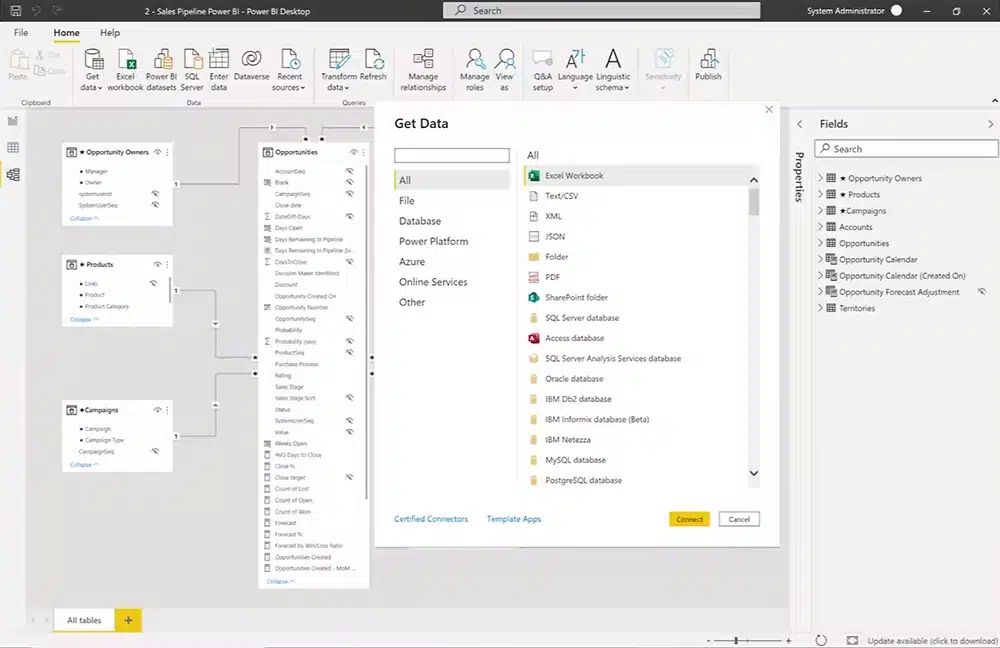
Microsoft Power BI is an analytical business intelligence tool that allows organizations to create visualizations and develop insightful reports that support data-driven decision-making. It includes an interactive dashboard that possesses a deep understanding of data and develops reports that make learning faster.
The dashboard in Power BI showcases interactive charts, graphics, and visuals, which make comprehension of information possible with trends and key metrics. The dashboards are customizable and provide accessibility across multiple devices, such as desktops, mobiles, or tablets. Power BI comes with three different price packages, including free, pro, and premium, each with distinctive software versions.
Components of Power BI
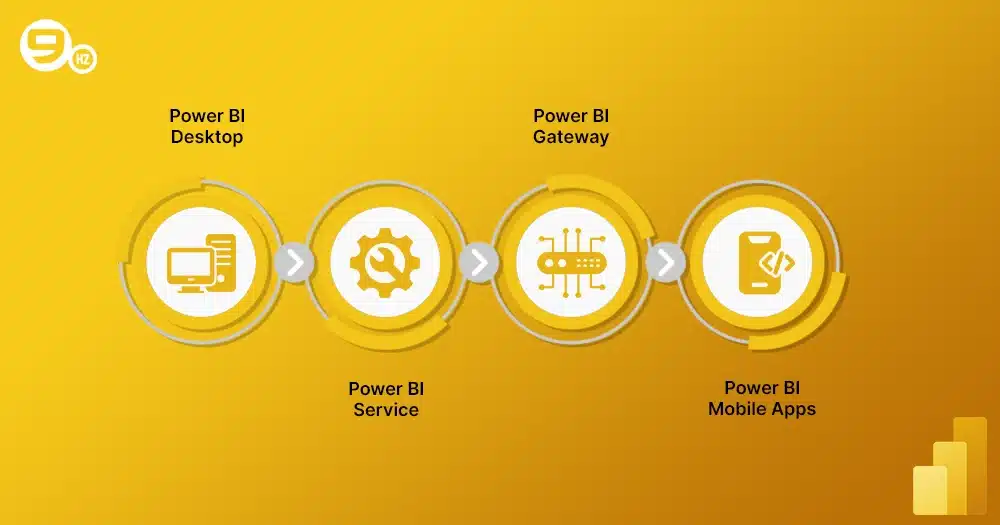
In your effort to make the right decisions at the right time, there are Power BI components that serve its usage. Here are some of them:
1. Power BI Desktop
It is a free version of Power BI that provides access to numerous data sources. Users can analyze transformed data on the desktop. They can also run advanced queries and prepare reports that can be shared within the enterprise.
2. Power BI Service
Businesses can use the Power BI service to access information on a cloud-based platform. Reports can be viewed online via a browser, and data publishing and sharing are executed in real-time, enhancing collaboration.
3. Power BI Gateway
Gateways transport data to on-site sources, where it is viewed without actually sending it. With scheduled on-demand data access, the data is kept current and secured with various encryption methods.
4. Power BI Mobile Apps
This component allows data access directly from mobile devices such as iOS, Android, and Windows. It enables touch-optimized visualizations that enhance accessibility in any location, and reports can be downloaded on a convenient handset.
Also Read
Is R Better Than Power BI?
Power Apps Vs Power Automate
Power Automate Use Cases
What are the Key Features of Power BI?
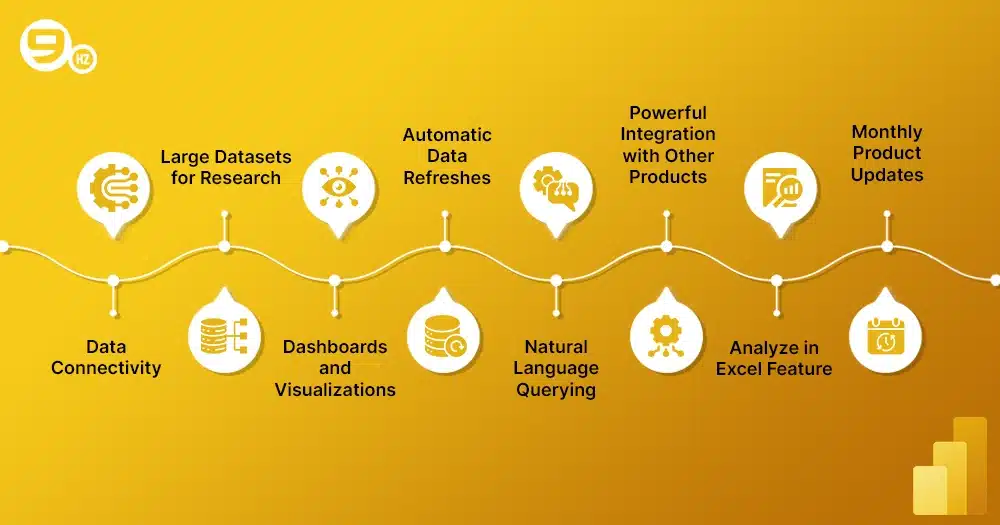
Using Power BI does not require you to be a data scientist. With a basic knowledge of data, you can use Power BI to create impressive visualizations. Let’s look at some features of Power BI which allow technical and non-technical users to do data analysis:
1. Data Connectivity
Power BI connects multiple data sources, including cloud data services, on-premise, and other live data streams. It can connect a multitude of data sources, ranging from factory equipment sensors, training services, employee satisfaction metrics, and CRM services, for easy data import for comprehensive analysis.
2. Large Datasets for Research
Analyzing datasets in Microsoft Excel with millions of rows can be complex and time-consuming. The dataset feature of Power BI allows the creation of insights from large datasets extracted from multiple sources. It can compress data and develop meaningful results by filtering data into smaller segments relevant to the analysis.
3. Dashboards and Visualizations
A dashboard is regarded as a fundamental feature in the Power BI desktop that allows visualizations based on different datasets. It can provide you with a summary of vital elements. For businesses, it can facilitate a single-page overview of a huge report or document, which can later be shared with others to improve collaboration and coordination in the workplace.
4. Automatic Data Refreshes
This feature is available in pro and premium accounts only. The automatic data refreshes allow scheduled data to be refreshed automatically when it approaches the decided time. This quick refreshing allows the reduction of manual updating of the data and provides insights to the team by sharing it with them.
5. Natural Language Querying
With natural language querying, one can get a low-code experience by facilitating quick responses to complex queries. Users can type any question in “Ask a question about your data” and get answers to the question from the massive amounts of data. The ease of cognitive capabilities like suggestions, autofill, and rephrasing will make the search more relevant and quick.
6. Powerful Integration with Other Products
Power BI tools can be seamlessly integrated with other Microsoft products like Azure, Teams, PowerPoint, and Word. Users can leverage similar functions and functionalities across these related tools for the true collaboration your business deserves.
7. Analyze in Excel Feature
Excel has over 750 million users seeming to be a number one data analysis tool. While sharing Excel reports, integrity is a concern that various BI analysts come across. For that, Microsoft has introduced analyzing datasets with Excel features for quick reporting. With this feature, users can do ad-hoc reporting and create Pivot Tables while preventing the integrity of connected environments.
8. Monthly Product Updates
Microsoft is attempting to improve business productivity by adding the latest features in Power BI. The Monthly updates feature is one such addition for the online community that prioritizes development. By continuously releasing new versions, Microsoft promises to improve users’ experiences and make improvements based on the community’s feedback.
Parexel, a clinical research organizations used Power BI for fast, accurate data visualization, reducing tooling costs by 85%, boosting staff efficiency by 30%, and cutting time to market by 70%.
Common Power BI Use Cases
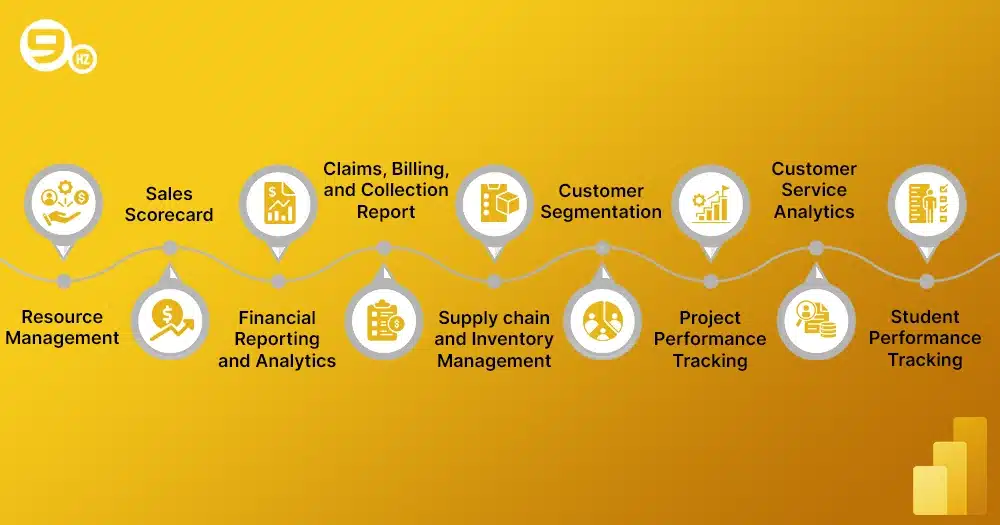
Microsoft Power BI has the potential to create compelling reports, bringing data to life. There are numerous built-in reporting features along with custom ad-ons that can help visualize data for important decisions. Now, let’s know how these can practically be used under different scenarios:
1. Resource Management
Power BI, with strong visualization capabilities, can be used to make better decisions related to task and resource allocation. Businesses use “Power Pivot” and “Power Query” to generate reports. With that, you can track the major KPIs like task count, number of open projects, project completed, and resource skills. The tool is applicable to the manufacturing sector, which has multiple production facilities in numerous locations.
2. Sales Scorecard
Managing salespersons is as hard as managing leads. Understanding if each individual is doing well determines the success of the sales initiatives. With Power BI, individual sales reports can be developed and viewed to track team performance. Slide and dice reports are reviewed based on the products, team performance, and geography-wise located salespeople.
3. Financial Reporting and Analytics
With the mindful use of the data visualization tool Microsoft Power BI, businesses have streamlined financial tracking. A financial reporting dashboard is often used to understand complex financial figures by having a bird’s-eye view of revenue streams and expenses. This would assist in quick decisions pertaining to cash flow through a product-wide data summary.
4. Claims, Billing, and Collection Report
Power BI tool will play a central role in the claim management process. It develops customized dashboards and data summaries that can help analyze claim data. The real-time view of the reports allows the claim processing team to communicate with the team and evaluate results. The insights derived from the data analysis can create a seamless experience for both customers and employees.
5. Supply Chain and Inventory Management
Microsoft Power BI can be integrated with supply chain operations to leverage the monitoring and optimization of inventory levels. It provides sophisticated dashboards for visualizing inventory levels and does demand and supply analysis that boosts decision-making. The real-time insights help operational teams identify bottlenecks and monitor supplier performance to maintain efficient supply chains.
6. Customer Segmentation
Even if you have an idea of who your customers are, you still lack the information for product positioning. When you use Power BI, you can attain a deep understanding of the customer segment by analyzing the behavioral patterns in specific groups. The customer segmentation dashboard allows you to prioritize the new products while focusing on the customer groups who are interested in your offering.
7. Project Performance Tracking
Power BI has various project management tools like Trello and Microsoft Project, which allow project monitoring by tracking key milestones. Managers can get real-time information about the project status, team performance, and resource utilization. They can identify potential risks by assessing the centralized dashboard that contains metrics for project progress. It leads to improved decision-making and better alignment of budget across multiple projects.
8. Customer Service Analytics
Quality customer service is regarded as a key to customer satisfaction, which is why organizations prioritize it. Power BI contains customer service analytics dashboards from which businesses can leverage several aspects of customer service. Metrics like customer feedback scores, customer satisfaction (CSAT) scores, sentiment analysis, and issue resolution rates are regularly measured to address service gaps promptly.
9. Student Performance Tracking
Educational institutes utilize the Microsoft Power BI tool to analyze the performance of students and determine enrollment trends. It is not only used for academic performance but it is also used for tracking the attendance and learning curves of students to examine the level of attention given to students to gain excellence. Power BI will help teachers recognize students with low productivity so that interventions can be established for their academic success.
Who Can Use Power BI?
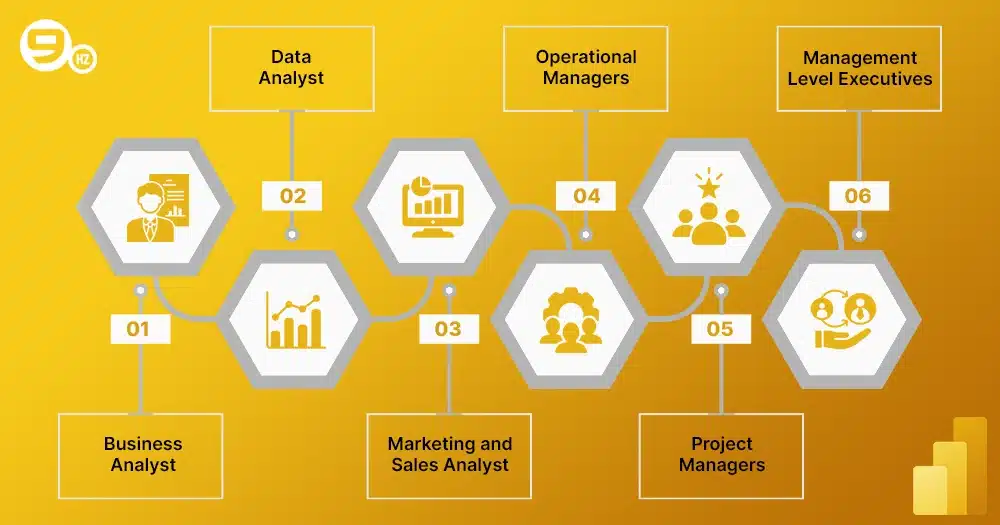
Being a versatile tool, Power BI can be used by different types of users who utilize this tool in their day-to-day activities. The purpose of this intelligent tool is to create a data-driven culture by empowering users with diverse roles and key capabilities to optimize operations and achieve excellence in their respective areas. Knowing about these user roles will decrease the chances of Power BI adoption failure and also help recognize the training needs for educating the functions of Power BI.
Here are the user roles of Power BI:
1. Business Analyst
Business analysts focus on deriving solutions for business problems by monitoring business operations. Data intelligence tools like Power BI can be a good companion for their analysis and interpretation. With power data modeling and a drag-and-drop interface, Power BI can help business analysts determine relationships between datasets so that they can make recommendations accurately.
2. Data Analyst
Data analysts routinely play with data. They perform statistical analysis through predictive modeling of data to convert it to layman’s terms. Power BI can be a helpful tool for visualizing data and deriving actionable insights. This tool can be integrated with other machine learning models to develop an intuitive dashboard that helps data engineers with their dynamic reporting needs.
3. Marketing and Sales Analyst
Marketing professionals are indulged in increasing the number of leads through running campaigns, tracking sales metrics, and planning on customer acquisition. Power BI, when integrated with other tools like Google Analytics and CRM systems, allows marketers to track daily metrics like a pro. They can understand campaign performance and measure customer engagement.
4. Operational Managers
Operational managers focus on managing routine business operations and suggesting solutions for prudent resource utilization and cost reduction. With active visualization offered by Power BI, operational managers can stream data and obtain real-time insights that help them stabilize supply chain performance. Actionable insights enable optimized processes and prompt maintenance that improve productivity.
5. Project Managers
Project managers work day and night to ensure the successful delivery of projects. For that, they plan and analyze, distribute tasks, allocate resources, and optimize budgets. With the help of Power BI, they can assess the project’s health by tracking down the key metrics. The dashboards will give a centralized view of all deliverables, which they can track and establish interventions if any deviations are found in the process.
6. Management-Level Executives
People at the management level are involved in making strategic decisions to bolster the financial performance of the enterprise. With Power BI as their companion, they can leverage their decision-making, which is backed by data. Power BI dashboard contains a comprehensive analysis of business KPIs that allows managers to undertake data-driven decisions. This means they would be able to exercise responsive leadership to make a strict alignment of decisions with the goals.
Industry-Specific Use Cases of Power BI
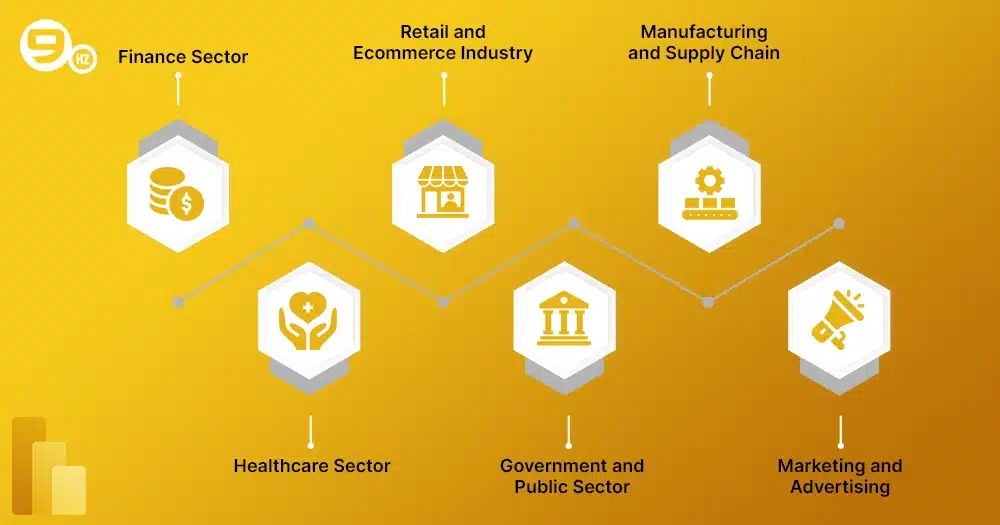
The presence of Power BI can be noticed in almost every industry. Power BI poses a strong impact across various industries by uncovering major data insights. Some industry-specific Power BI use cases are mentioned below:
1. Finance Sector
Financial performance overview dashboards give a high-level view of a company’s fiscal data, easing the complexities of the finance industry. The insights gathered from these interactive dashboards are used to analyze past performance and anticipate future trends, contributing to confident decision-making.
2. Healthcare Sector
Precision is key in the healthcare sector, and that’s when Power Bi comes into play. It takes visualization to the next level with hospital performance analytics and compliance report generation. Additionally, Power BI helps track patient outcomes and operational efficiency to ensure quality care is rendered to patients. By supporting a data-driven approach to patient care, healthcare organizations are able to establish streamlined healthcare delivery.
3. Retail and E-commerce Industry
Modern retailers rely on intelligent tools like Power BI to gain customer insights, such as their desires and preferences, to alter marketing efforts. In addition, sales and product data can be analyzed with the help of integrated Power BI tools to achieve results pertaining to sales data and seasonality, which can improve inventory management and incorporate lucrative pricing strategies.
4. Government and Public Sector
Government agencies leverage the Power BI functionalities to measure the impact of policies and create budgets that increase transparency across stakeholders. It can deeply visualize the data for undertaking informed decisions that consider the public interest. Many organizations strive to determine the citizens’ needs through Power BI capability by tapping deep into service requests, feedback, and more.
5. Manufacturing and Supply Chain
The manufacturing sector’s use of a Power BI application can be seen from its capability to perform advanced analytics that support supply chain planning. Using self-service models, it can build customized reports in real-time without requiring any core technical skill. You can effectively monitor supplier performance and identify bottlenecks in supply chains to optimize operations and cut unnecessary costs.
6. Marketing and Advertising
Power BI contains a marketing campaign dashboard that describes the status of your project campaign and analyzes performance. Its visualization allows marketers to focus on relevant campaigns and determine the need to run marketing campaigns in the future. With customer sentiment analysis and conversion rate recognition, it provides an idea to marketing professionals for increasing the ways to improve customer experience.
If you’re interested in learning more about Power Platform tools, explore:
Why is Power BI a Powerful Tool for Data Analysis and Visualization?
When it comes to making important decisions, Power BI is a lucrative tool to make visualizations with the help of data-driven dashboards. It can transform raw data into analytical data to give a comprehensive view of business performance and more. This can improve communication across the departments and even help save time wasted on going through hefty files manually. Still, wondering how it can be a powerful tool for data analysis? Let’s look at some crucial benefits that can assist in the visualization of data:
1. User-friendly Interface
Power BI is designed to make dashboards accessible for visualizations. Even if you do not have technical expertise, you can use the tool by harnessing the drag-and-drop capability. It has pre-built templates from which users can develop reports in charts, maps, and graphics. The reports can be customized according to screen size, theme, and orientation.
2. Extensive Data Connectivity Options
This tool has extensive data connectivity options that facilitate seamless integration with multiple databases. Users can access data from SQL servers, MySQL, and even Azure Cloud for doing visualizations that convert robust decision-making. Not only cloud services, Power BI can be connected with on-premise services as well for collecting information and providing regular updates on the analysis made.
3. Powerful Data Transformation
The raw data comes into diverse formats, requiring you to reshape and filter it into a useful structure. Its effective feature, “Power Query,” is a robust data transformation and cleansing tool that would convert it into meaningful formats. You can merge data, filter information, and create custom functions to adapt to the data requirements. This process is reproducible and can do consistent analysis, making it a vital tool for extracting valuable insights.
4. Advanced Analytics and AI Integration
When you integrate Artificial Intelligence into Power BI, you can go beyond basic visualization with the establishment of machine learning and AI algorithms. This allows deep analysis, uncovering hidden patterns and trends that contribute to anticipating outcomes in advance. AI-driven features like decomposition trees and NLP queries allow users to extract data continuously, fostering a culture driven by the power of data.
5. Customizable Visualizations
Multiple visualization types are in the Power BI feature list to promote interactivity. You can customize your data visualization using formats like charts, tables, graphics, and more. This way, you can turn data into engaging stories and explore the information dynamically. Plus, custom visuals can be created, making it a diverse business function for tracking performance and analyzing customer segments.
6. Collaboration and Sharing
Decisions are backed by conclusions drawn from team discussions. With effective collaboration, many crucial decisions can be made. Power BI can be used as a sharing platform where data analysis reports and dashboards are shared securely in a cloud-based environment. Additionally, role-based access controls will allow restricted access to sensitive data.
7. Data Security and Compliance
Power BI stands out with data security protocols since it takes comprehensive measures to ensure the safety and security of personal data. With role-based access, unauthorized access is denied, and encryption methods are enforced when data is transferred. In this way, it has an unwavering focus on protecting data security standards and compliances that make it a top choice for BI tools that many businesses can rely on.
8. Active Support
The strength of Power BI is its ability to provide strong community support, which makes it distinctive amongst other BI tools. It has a robust support network and takes community feedback seriously. This can be seen in the regular updates and enhancements that are launched, keeping in mind the evolving needs of users. For many critical issues, Power BI has premium support options that are available around the clock.
Real-Life Examples of Companies That Use Power BI

Data is the fuel for prompt and precise decisions. Empowering the intelligence to deal with complex data is needed to thrive in this digital age. Many companies are reaping the benefits of Power BI in transforming legacy data management systems into cloud-based solutions. Let’s look at some case studies of companies and how they are reaping commercial success with the power of visualization:
1. MediaCom
MediaCom is the largest cable TV provider that needs to measure diversified datasets across multiple media channels. In the urgency of increasing the feasibility of analyzing data from different sources, Power BI provides single-sourced data gathered from numerous sources. Customized dashboards of Power BI enabled them to analyze different metrics such as audience demographics and ROI. Eventually, the company spent less time analyzing individual reports as they had a comprehensive single report that dictated the impact of campaigns and ad performance.
2. Heathrow
Heathrow Airport UK has adopted Power BI to streamline management and airport operations. The tool helps visualize data from numerous areas, like checkpoints and luggage handling, to obtain real-time information regarding traffic in the passenger flow. This gives employees an idea of how to proactively manage traffic conditions to facilitate a less stressful traveling experience for passengers. With the data intelligence, the company runs Airport operations more smoothly than ever before.
3. Walmart
A giant retail chain, Walmart, attempts to use Power BI to manage operational data across its vast network of stores. The company has complex supply chains due to the many stores, which creates difficulty not only in gathering data but also in measuring performance. With Power BI, they transformed their data management approach by bringing a single analysis platform for a unified view. By getting access to real-time issues, the company strategized for a risk management plan that dealt with issues promptly. In terms of its outcomes, predictive analytics made inventory management possible and empowered employees to undertake data-driven decisions.
4. Metro Bank
The challenge with Metro Bank was not being able to track its financial performance and establish standards for reporting compliances. With the help of the Power BI tool, the company created financial dashboards for tracking down real-time data and also measuring the financial metrics. As a result, the reporting time for Metro Bank was reduced by 30%. The accurate reporting and streamlined data management allowed fewer errors. Employees also got freed up from managing individual reports and emphasized more on strategic planning.
Why Choose The NineHertz for Microsoft Power BI Services?
As a reputed IT company and trusted partner, The Ninehertz has the privilege of integrating Power BI into enterprise systems. At The NineHertz, We offer Microsoft Power Platform Services, including Power BI development, to transform raw data into actionable insights. The company offers a variety of Power BI services, including Power BI migration, Power BI consulting, and Power BI reporting. We provide intelligent solutions while supporting you throughout the process.
Conclusion
If you are thinking of implementing the data intelligence tool into your organization, advice giving a chance to Microsoft Power BI. It can be applied to any industry and can be used by every employee as it requires little or no coding skills. Its interactive low-code tools and friendly interface make it a top choice for driving insights from large and diverse datasets. In order to realize the visualization as per your business need, consider hiring a consultant to leverage big data seamlessly with the help of advanced analytical tools.
Frequently Asked Questions
What is Power BI, and why is it used?
Power BI is a business analytics tool by Microsoft. It helps you analyze data and share insights. You can connect it to different data sources, transform the data, and create interactive reports and dashboards.
Who can benefit from Power BI use cases?
Power BI is useful for everyone. It can help businesses of any size, data analysts, IT teams, and business leaders. If you want to understand your data better, Power BI is for you.
What kind of data sources can Power BI connect to?
Power BI connects to a wide range of data sources, including Excel, SQL Server, Azure, Google Analytics, Salesforce.
What are some common Power BI dashboard examples?
With Power BI, you can create many types of dashboards. You can track sales performance, monitor employee productivity, and analyze marketing data. You can also manage daily operations with detailed dashboards.
How can I get started with Power BI?
Getting started with Power BI is easy. Download and install Power BI Desktop from Microsoft. Connect it to your data, like Excel files or databases. Create visualizations using charts and graphs to explore your data. Share your reports online with Power BI Service. Start small, practice, and improve as you go!
How can I share Power BI reports and dashboards?
You can share reports and dashboards through:
- Power BI service
- Embedding in websites or applications







Discussion about this post