








Global temperatures in 2023 blew past expectations to set the warmest year on record, even topping 1.5C in one of the main datasets.
This warmth has continued into 2024, meaning that this year is also on track to potentially pass 1.5C in one or more datasets.
Crossing 1.5C in one or even two years is not the same as exceeding the 1.5C limit under the Paris Agreement. The goal is generally considered to refer to long-term warming, rather than annual temperatures that include the short-term influence of natural fluctuations in the climate, such as El Niño.
Nonetheless, recent warming has led to renewed debate around whether the world might imminently pass the 1.5C Paris Agreement limit – sooner than climate scientists and Intergovernmental Panel on Climate Change (IPCC) have previously estimated.
Here, Carbon Brief provides an updated analysis of when the world will likely exceed the Paris 1.5C limit (in a scenario where emissions are not rapidly cut), using both the latest global surface temperature data and climate model simulations.
The findings show that, while the best estimate for crossing 1.5C has moved up by approximately two years compared to Carbon Brief’s earlier 2020 analysis, it remains most likely to happen in the late 2020s or early 2030s – rather than in the next few years.
Understanding global temperature targets
Human emissions of CO2 and other greenhouse gasses have substantially warmed the planet over the past 150 years. On top of this human-driven warming, there is year-to-year natural variability largely associated with El Niño and La Niña events.
A big El Niño or La Niña event can result in global temperatures up to 0.2C warmer or cooler, respectively, than they would otherwise be.
As the world has been warming by around 0.2C per decade, a large El Niño event can represent an early look at what typical global temperatures will be a decade in the future. Or, to put it another way, human emissions are adding a permanent super-El Niño’s worth of heat to the climate system each decade.
In the 2015 Paris Agreement, the international community agreed to limit warming to well-below 2C above pre-industrial levels and “pursue efforts to limit the temperature increase to 1.5C”. While there is no set definition for the time period against which the goal is measured, it is generally interpreted to refer to long-term, human-driven warming.
For example, the IPCC’s recently completed sixth assessment report (AR6) uses the midpoint of a 20-year period as a way to avoid overinterpreting short-term natural variability.
While a useful approach, this definition has the unfortunate side-effect that scientists will not know for sure that the world passed 1.5C until 10 years after it has happened.
This has led the community to propose a number of alternative approaches, such as Carbon Brief’s 2020 analysis and a 2023 Nature commentary by Prof Richard Betts and colleagues at the UK Met Office.
An updated approach for determining exceedance
Here, Carbon Brief provides an update to our 2020 analysis of both observations and the latest generation of climate models to assess when the world will likely pass the 1.5C limit across different surface temperature datasets.
While the IPCC’s 20-year average is one approach to remove short-term variability, it comes with the important downside of not being able to extend up to the present day. An alternative approach is a smoothed average using a local regression (LOWESS).
LOWESS provides an estimated value at each point in time based on a weighting where nearby points are given the highest weights and those further away are given less weight. It is an approach commonly used in timeseries analysis that can account for changes in the behaviour of data over time without assuming it is linear.
However, LOWESS approaches still require a choice on the part of the user; namely, how many nearby points should be considered when determining the smoothed average. The figure below shows three potential options that could be used: a window of the nearest 10 years, 20 years or 30 years around each point.
The data shown are a composite average of four different global surface temperature records – NASA’s GISTEMP; NOAA’s GlobalTemp; Hadley/UEA’s HadCRUT5; and Berkeley Earth – that extend back into the 1800s.
Annual global mean surface temperatures from a composite average of NASA’s GISTEMP, NOAA’s GlobalTemp, Hadley/UEA’s HadCRUT5, and Berkeley Earth (black dots) along with LOWESS fits using 10-year, 20-year, and 30-year windows. Chart by Carbon Brief.
In this case, both 20-year and 30-year windows show similar long-term changes in temperature, while a shorter 10-year window does not fully remove short-term variability associated with El Niño and La Niña events.
For this analysis, Carbon Brief selected a 30-year window for removing natural variability, though a 20-year window would have given nearly identical results. (As discussed above, there are a number of alternative approaches that could be used. These are assessed in the UK Met Office’s Climate Dashboard, though they all give comparable results to the LOWESS approach used here.)
To determine when the world will pass 1.5C and 2C, Carbon Brief combines smoothed averages of both observed temperatures and climate model projections.
The observed temperatures are used to determine the level of warming to date – 1.3C in the composite average – while climate models are used to assess the range of possible warming into the future. This approach has an advantage over just using climate models as it avoids any historical mismatch between modelled and real-world temperatures.
The figure below shows the combined smoothed average from the observations and climate models, with the climate models normalised to the observations in 2023. Global temperatures are assessed to be 1.3C in 2023, with a wide range of possible future warming determined by the spread in warming after 2023 across 37 different climate models in the CMIP6 ensemble using the SSP2-4.5 current-policy-type scenario.

Annual global average surface temperatures from the composite average (black dots) along the 30-year LOWESS fit (black line), combined with 37 CMIP6 models smoothed using the same 30-year LOWESS fit. Models and observations are aligned using the smoothed average values for 2023. Chart by Carbon Brief.
This approach suggests that the world will pass 1.5C around the year 2030 (representing the 50th percentile, or central estimate, of all the model runs), with a range of anywhere from 2028 (5th percentile) up to 2036 (95th percentile).
Similarly, the world will pass 2C around the year 2048, with a range of 2040 to 2062 across all models assessed.
The figure below shows distribution of exceedance years (that is, the year in which the target is exceeded) across all of the different CMIP6 models. The width of the plot indicates the portion of models that show the temperature limit passed in a given year – the wider the plot, the more agreement across the models.

The results are broadly similar to Carbon Brief’s 2020 analysis, though the best estimate of when the world will pass 1.5C has moved up from 2032 to 2030, reflecting both a higher estimate of warming to date (including the development of HadCRUT5) and an inclusion of more CMIP6 model runs than were available at the time.
The 5th and 95th percentile has narrowed to 2028-36 compared to 2026-42 in the 2020 analysis, showing the impact of three additional years of data on reducing the resulting model spread.
Sensitivity to the choice of datasets
While the averaging of different datasets into a composite average follows the approach used in the IPCC AR6 and by the WMO, it somewhat obscures important differences in estimates of warming since pre-industrial times across different research groups.
While the long-term warming the world has experienced in the composite average is 1.3C as of 2023 (similar to the results in the new Forster et al study), applying the same LOWESS smoothing approach to each individual record yields fairly different results, ranging from as low as 1.22C to 1.41C across the four different groups:
- Composite Average: 1.30C
- Berkeley Earth: 1.41C
- HadCRUT5: 1.30C
- NASA GISTEMP: 1.24C
- NOAA GlobalTemp: 1.22C
These differences reflect a number of factors, including what land station data is included in each record, the ocean sea surface temperature datasets used and how different groups fill in the gaps between observations – particularly in the early part of the record when station data is more sparse.
The table below gives the resulting 1.5C exceedance years when Carbon Brief’s approach is applied to each different temperature record:
| Projected year of 1.5C breach | |||
|---|---|---|---|
| Dataset | 50th percentile | 5th percentile | 95th percentile |
| Composite | 2030 | 2028 | 2036 |
| Berkeley Earth | 2027 | 2025 | 2031 |
| HadCRUT5 | 2030 | 2028 | 2036 |
| NASA GISTEMP | 2032 | 2029 | 2040 |
| NOAA GlobalTemp | 2033 | 2030 | 2041 |
Using the Berkeley Earth record gives a central estimate of passing 1.5C as early as 2027 (ranging from 2025 to 2031), while NOAA gives an estimate as late as 2033 (2030 to 2041).
Similarly, here are the results for the 2C exceedance year:
| Projected year of 2C breach | |||
|---|---|---|---|
| Dataset | 50th percentile | 5th percentile | 95th percentile |
| Composite | 2048 | 2040 | 2062 |
| Berkeley Earth | 2045 | 2037 | 2056 |
| HadCRUT5 | 2048 | 2040 | 2062 |
| NASA GISTEMP | 2050 | 2041 | 2067 |
| NOAA GlobalTemp | 2051 | 2042 | 2068 |
It is worth noting that there is no “correct” answer as to the best surface temperature record to use. Rather, the range of results across the different records represent real uncertainty around when the world will pass 1.5C and 2C.
Other approaches get similar results
This analysis is far from the first time the scientific community has asked when the world will pass various climate limits or how to best calculate the level of warming the world has experienced to date.
Copernicus/ECMWF provide a regularly updated “global temperature trend monitor” that uses a more simple approach – a linear trend over the past 30 years – to assess when global temperatures will likely exceed 1.5C in their ERA5 dataset.

This approach gives a slightly later date, 2033, than the climate model-based approach Carbon Brief uses. This reflects the fact that most models anticipate a modest acceleration in the rate of warming that might not be fully captured using a linear trend over the past 30 years.
An alternative approach to determining when the world will pass 1.5C is to use the “assessed warming projections” developed for AR6. These assessed warming projections more closely match observed temperatures than the full CMIP6 ensemble.
They also provide a narrower range of future warming than the full set of CMIP6, as they give less weight to “hot models” in CMIP6 that are inconsistent with the IPCC’s assessment of the likely range of climate sensitivity.
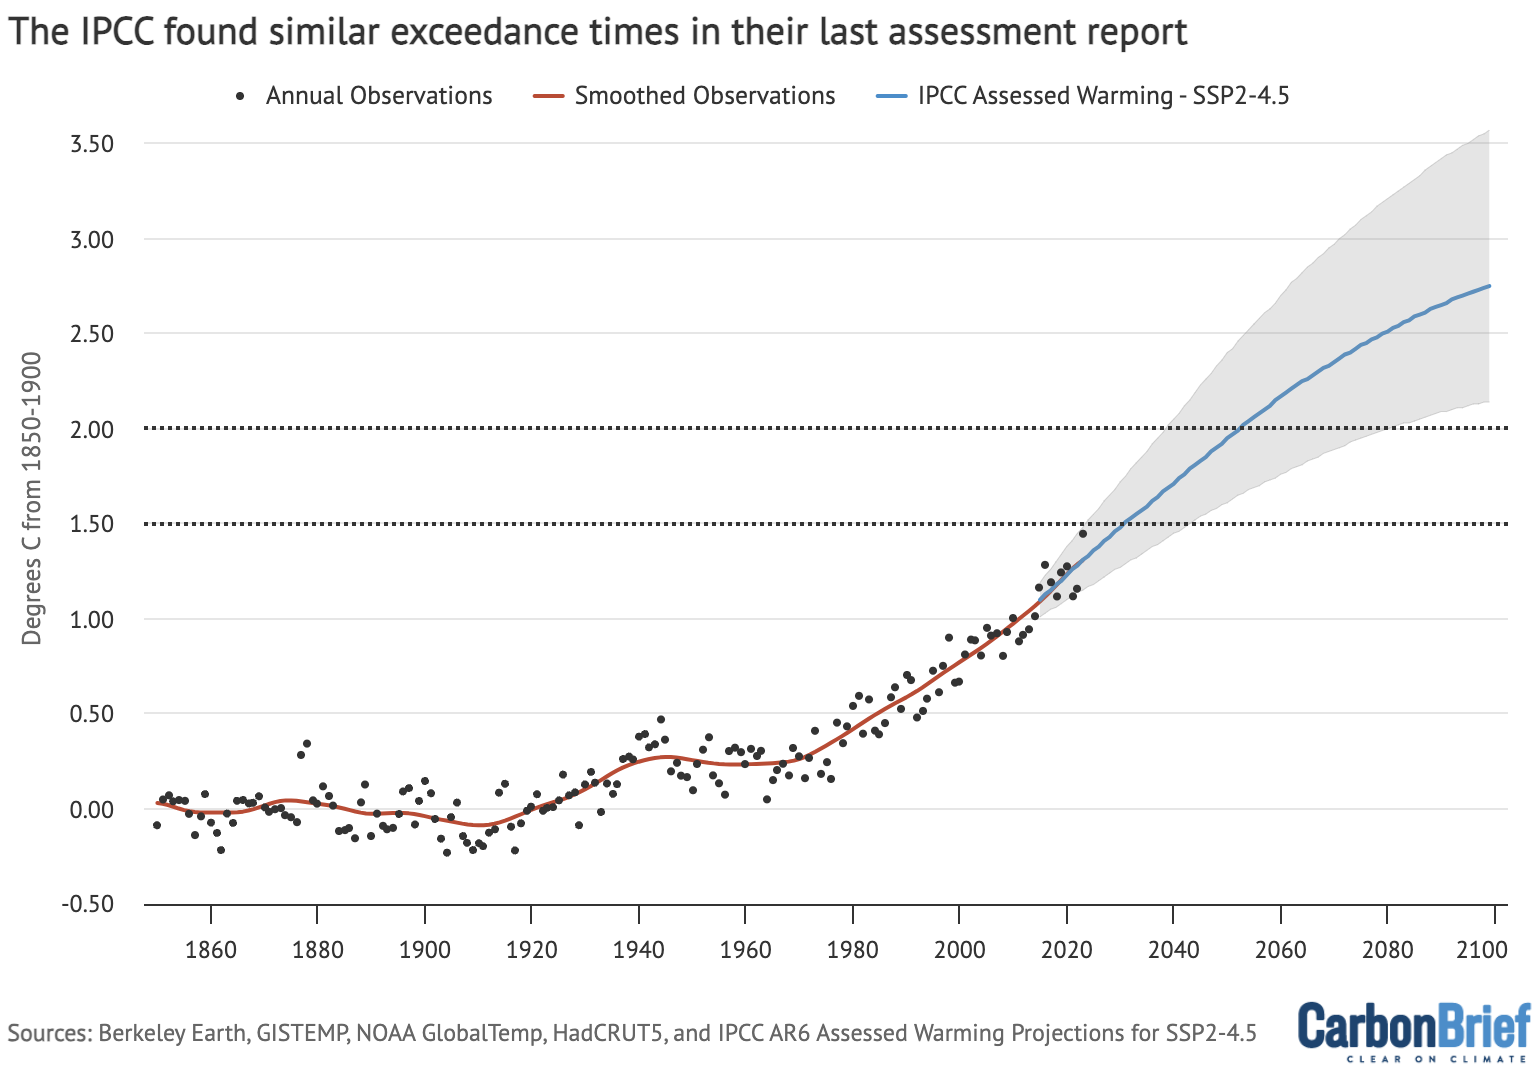
Annual global average surface temperatures from the composite average (black dots) along the 30-year LOWESS fit (red line), combined the AR6 assessed warming projection for SSP2-4.5 as published and without any baseline alignment. Chart by Carbon Brief.
In addition, AR6 features an estimate of 1.5C exceedance dates based on the ScenarioMIP assessment of CMIP6 models (and previously covered by Carbon Brief here).
These three different approaches are compared to Carbon Brief’s new assessment in the table below:
| Approach | 1.5C exceedance year |
|---|---|
| Carbon Brief (Composite, SSP2-4.5) | 2030 (2028 to 2036) |
| Copernicus | 2033 |
| AR6 Assessed Warming (SSP2-4.5) | 2031 (2024 to 2043) |
| AR6 ScenarioMIP (SSP2-4.5) | 2030 (2021 to 2046) |
Both AR6 approaches include a wider range than the Carbon Brief approach as they rely on models that have differing estimates of current global temperatures relative to pre-industrial.
For example, the AR6 assessed warming projections give a best estimate of 2023 global temperatures (in the absence of short-term natural variability) as 1.31C, with a range from as low as 1.15C to as high as 1.48C. However, these are comparable to the range of warming to date (1.22C to 1.41C) across the different surface temperature records.
There is no single best way to assess when the world will likely pass 1.5C. But both Carbon Brief’s approach and those of other groups all agree it will most likely happen in the late 2020s or early 2030s in a world (SSP2-4.5) where global emissions remain around current levels.
Sharelines from this story










Discussion about this post