Categories
Energy

Q&A: Can China turn hydrogen into its next clean-energy industry?

China has said that hydrogen is a key “future industry”, important to both its energy transition and its industrial policy.

Hydrogen frequently goes through hype cycles, most recently driven by rising oil and gas prices due to the conflict in the Middle East.

Yet, even in China, the world’s largest producer and consumer of the fuel, hydrogen remains expensive and inefficient to produce.

This is especially the case for “green” hydrogen derived from renewables.

Moreover, there is limited supporting infrastructure and there is little incentive to use hydrogen over other energy sources.

As a result, uptake in China of hydrogen as an alternative fuel remains low.

Nevertheless, these challenges echo the early circumstances of another key clean-energy technology – electric vehicles (EVs).

In China, EVs benefited from a policy environment that included consistent signals of support, financial aid and the development of supporting infrastructure.

Many similar policies are now being deployed – and in some cases improved upon – to support the development of China’s hydrogen industry.

This article examines China’s approach to developing hydrogen and how its evolving industrial policy could make the fuel viable.

How is China using hydrogen and where does it come from?

Electrification and rising installations of solar and wind power have been the biggest drivers of China’s decarbonisation story so far. However, how China will address the more energy-intensive, hard-to-electrify segments of its economy remains an open question.

Hydrogen is seen by some in China as a potential solution for reducing emissions in a range of “hard-to-abate” industries, from steel and chemicals to aviation and shipping.

The country is the world’s foremost producer and consumer of hydrogen. It produced 36.5m tonnes of the gas in 2024, with maximum production capacity standing at 50m tonnes that year.

It also consumed nearly a third of the world’s hydrogen in 2024, as shown below.
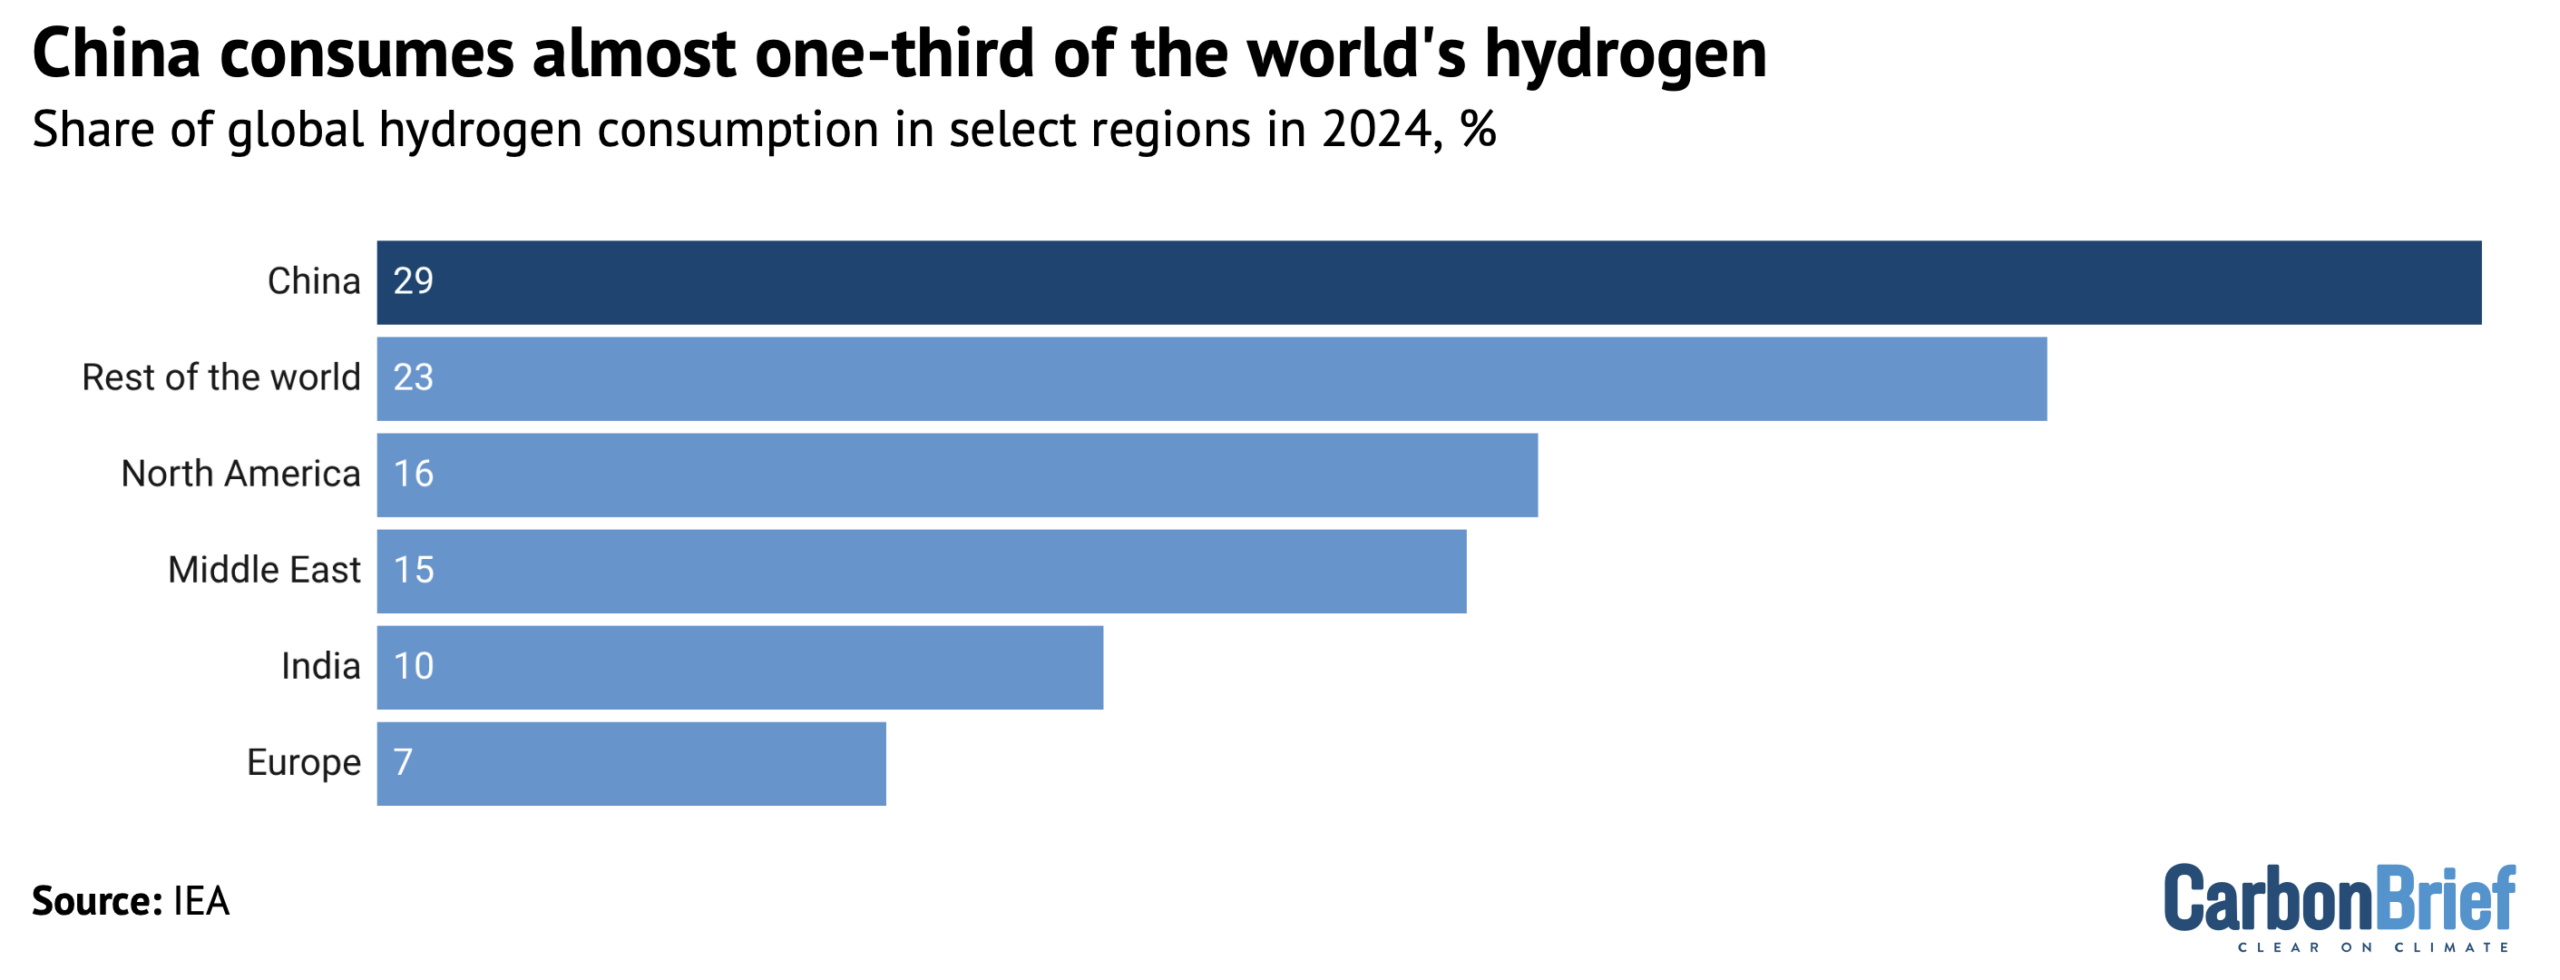
Share of global hydrogen consumption in select regions in 2024
Share of global hydrogen consumption in select regions in 2024, %. Source: IEA.

Most of China’s production capacity is in regions with potential for high demand, such as Shandong, Inner Mongolia, Shaanxi, Ningxia, Shanxi and other provinces with significant heavy industry.

In 2024, the vast majority of China’s hydrogen – around 78% – was produced using fossil fuels, predominantly coal and gas, as shown in the figure below.

Another 21% was produced as an industrial by-product, while only 1% – just 320,000 tonnes – was derived from renewable-powered electrolysis of water. 
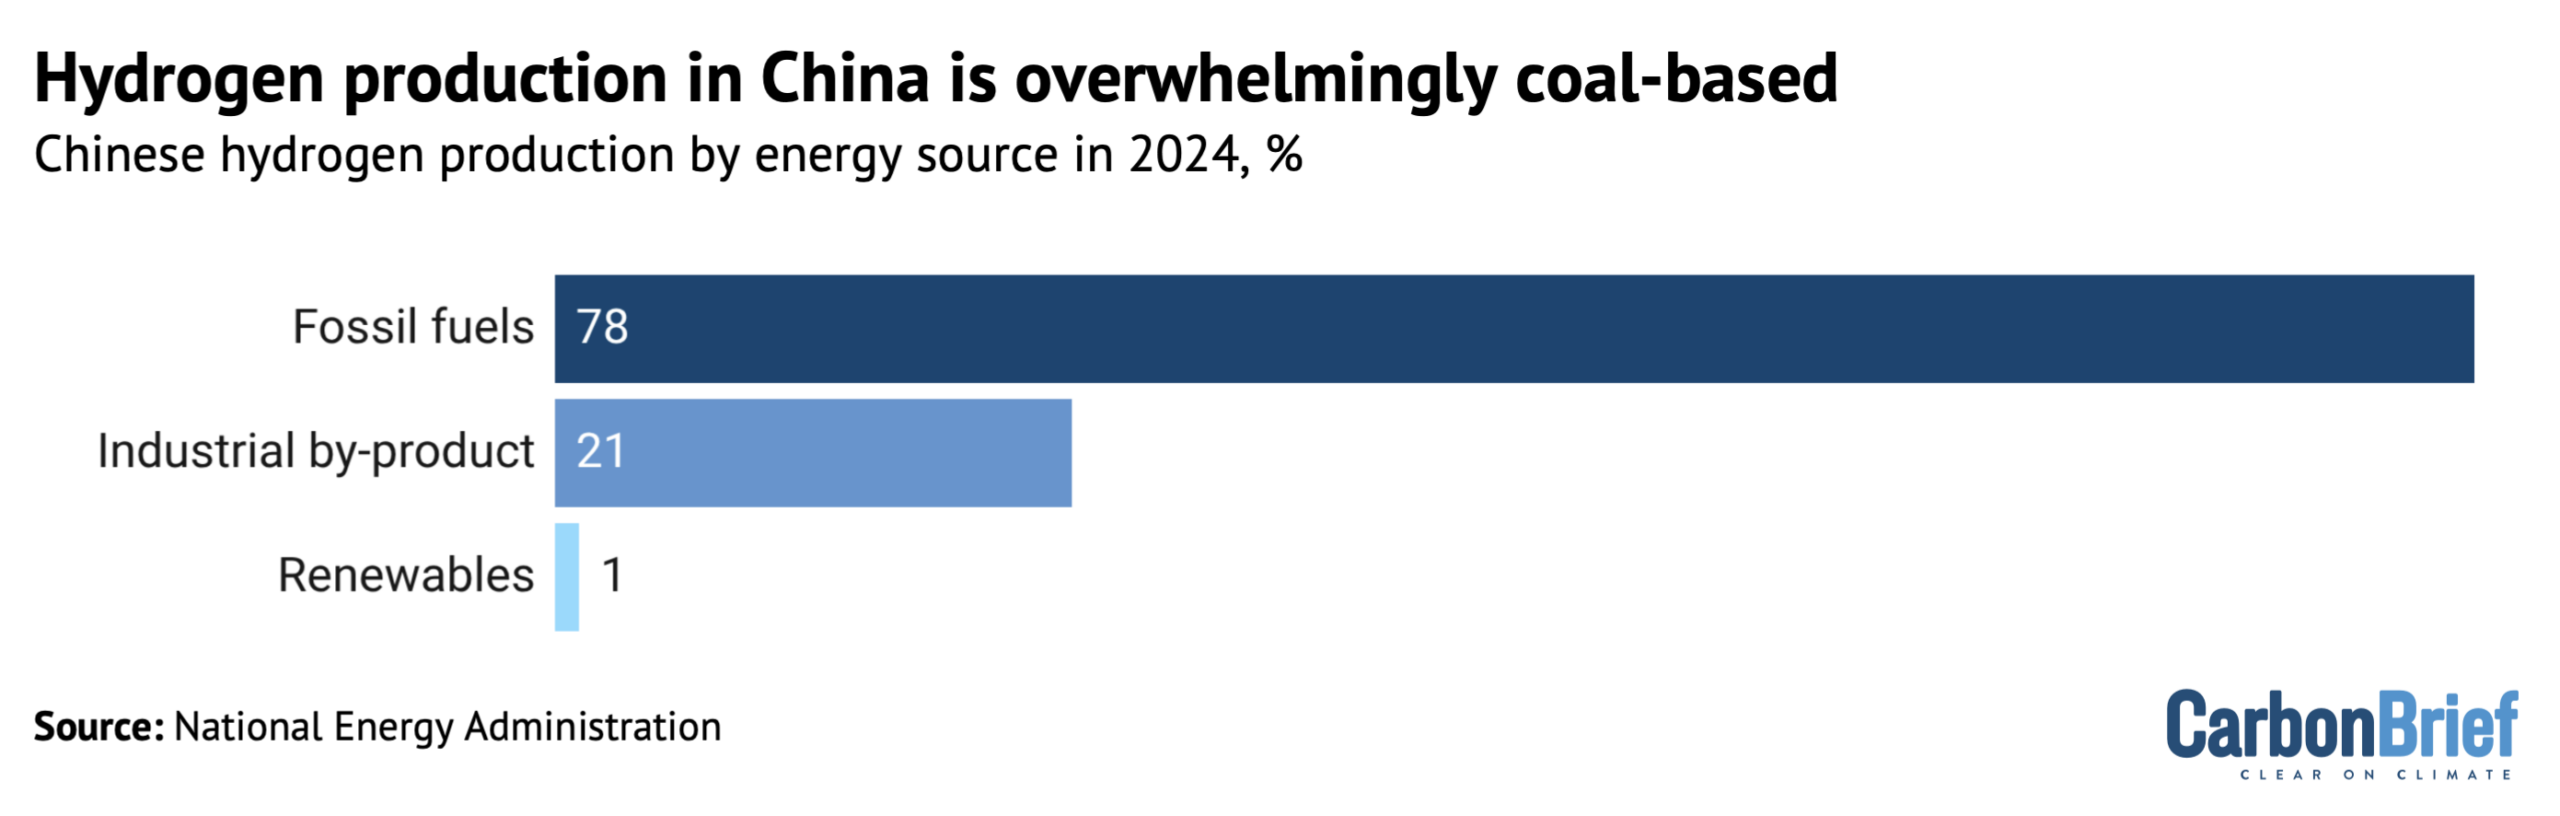
Production of hydrogen in China by energy source in 2024
Production of hydrogen in China by energy source in 2024, %. Source: National Energy Administration.

One study found that, for every kilogram of hydrogen produced, 38.6kg of carbon dioxide (CO2) is emitted if the hydrogen is produced using coal-fired power. Hydrogen made through coal gasification results in 28.5kg of CO2 for every kilogram of hydrogen, while gas-based hydrogen creates 13kg of emissions. 

By contrast, one kilogram of renewables-based hydrogen results in 0.5kg of CO2.

The International Energy Agency (IEA) calculates that hydrogen and hydrogen-based fuels could help China avoid close to 16bn tonnes of CO2 cumulatively by 2060 – but only if it comes from low-carbon sources. 

The biggest reductions, it adds, would come from heavy industry, particularly chemicals and steel, with the maritime and shipping sectors also seeing some benefit. 

Currently, around half of the hydrogen produced in China is used in synthetic ammonia and methanol production. 

Ammonia is primarily used to manufacture fertiliser and is seen as a possible fuel technology for shipping. Methanol is used as a fuel for the transport industry, as well as for heating. 

Another quarter of China’s current hydrogen usage is consumed by the oil refining and coal-to-chemical sectors. The remaining amount is used in other industries, including transport, heating and metallurgy.

What are the barriers to scaling up hydrogen?

Although China is the largest producer and consumer of hydrogen globally, the industry faces several barriers to becoming a viable clean-energy technology.

Agora Energiewende, a thinktank focused on the energy sector, says that, in order to make hydrogen a practical clean-energy solution, China would need to expand the scale and range of its application, as well as improving the conversion efficiency of production and use.

Both BloombergNEF and the IEA highlight the importance of China creating demand for hydrogen, such as through quotas for industrial usage.

Hydrogen “suffers from a relatively large efficiency loss during various conversion processes”, adds Agora. For example, it notes that only around 22% of the energy put into hydrogen fuel-cell electric vehicles (FCEVs) is converted into motion, compared to 73% for battery electric vehicles. Producing hydrogen with renewable energy is also less efficient than coal-to-hydrogen processes.

Cui Chuansheng, technical director at East China Engineering Science and Technology, tells state news agency Xinhua that the variability of wind and solar power often leads to low utilisation of electrolysers, resulting in “efficiency losses”.

Meanwhile, the cost of producing hydrogen – particularly green hydrogen – remains high.

One study placed the cost of hydrogen produced through alkaline water electrolysis (AWE), the most common method for producing green hydrogen in China, at $4-6 per kilogram, compared with $1.20-2.50/kg for steam methane reforming and $1.30-2 for coal gasification.

In some specific cases, such as blending hydrogen with gas, researchers find that hydrogen prices would need to fall to one-third of gas prices to incentivise uptake. 

These constraints are all “interdependent”, Kevin Tu, managing director of Agora Energy China, tells Carbon Brief, with the need to ensure “bankable demand” while also reducing costs and developing infrastructure. He adds:

“Without credible offtake in the right sectors, costs will not fall; without lower costs and better logistics, downstream users will not commit.”

The IEA says that green hydrogen “could become cost-competitive by the end of this decade due to low technology costs and cost of capital”.

For now, however, the China Hydrogen Bulletin Substack reports that China’s four listed hydrogen equipment manufacturers all reported significant losses in 2025.

Meanwhile, a senior executive at a Chinese hydrogen company told economic news outlet Jiemian that he expected 40% of companies in the sector to have closed down by the end of 2026, with surviving companies only turning a profit in 2029 at the earliest.

The industry also lacks refueling and pipeline infrastructure. China’s development of a pipeline network for hydrogen remains in its early stages, with around 400km of pipelines currently in operation. By contrast, its long-distance gas network stands at 128,000km. Similarly, storage remains expensive and inefficient, creating a further obstacle to wider uptake. 

How is China supporting hydrogen development?

China began considering the use of hydrogen as an energy source in earnest in the early 2000s, to address concerns around pollution and dependence on imported oil for the transport sector. 

A clearer signal of its importance came in 2015, when the State Council included the technology in a 10-year national industrial strategy known as the “Made in China” initiative. This pitched hydrogen as a way to contribute to electrification of China’s road-transport system through the development of FCEVs. 

Yuki Yu, founder of research firm Energy Iceberg, tells Carbon Brief that, from 2018-2021, hydrogen was treated as a “FCEV and manufacturing technology challenge”. 

This has since evolved, she says, given that battery electric vehicles have emerged as the more popular technology. 

Shen Xinyi, senior advisor at the Centre for Research on Energy and Clean Air (CREA), agrees, telling Carbon Brief that recent policy documents suggest the aim is now for hydrogen to be targeted at areas where direct electrification is harder, such as hydrogen-based chemicals, hydrogen metallurgy and some heavy-duty transport applications.

This is in line with the “hydrogen ladder”, an analysis of how likely different possibilities for applying hydrogen as a clean alternative are to become significant. The ladder sees significant future use of hydrogen in these hard-to-electrify areas as much more likely than for light vehicles. 

Notable policy moves are being made in “three layers”, says Agora’s Tu, which are combining to improve the technology’s chances of scaling up. These are: the “legal and institutional” layer; “application-oriented” policies; and targeted measures to address “practical bottlenecks” at the local level.

One of the documents underpinning this pivot was the “medium- and long-term plan for the development of the hydrogen energy industry (2021-2035)”, issued in March 2022.

According to a report by the National Energy Administration (NEA), the plan is an attempt to develop an “industrial ecosystem” for hydrogen that features “diverse stakeholders, coordinated innovation and clustered development”.

The plan was the first government document to “lay out a long-term vision for China’s hydrogen economy”, unifying a previously disparate policy push into one document, according to the Oxford Institute for Energy Studies, a UK-based thinktank.

Following on from the 2022 plan, the importance of hydrogen as a broad clean-energy solution has been emphasised in a number of policies. These include its classification being changed from a hazardous chemical to an energy carrier in China’s Energy Law, a 2024 action plan to “accelerate” the use of low-carbon hydrogen in industry and a new pilot scheme offering subsidies for projects that achieve specific targets. 

The table below sets out the timeline and content of China’s hydrogen-related policies over the past 25 years.

Policy Year published Key features
10th five-year plan (2001–2005) 2001 Calls for “actively developing” low-emission vehicles, understood to include hydrogen vehicles
Made in China 2025 2015 Pledges to “continue to support” development of fuel cell vehicles and “master core technologies” for low-carbon vehicles
Notice on implementation of demonstration projects for fuel cell vehicles 2020 Creates a dedicated subsidy programme for finding breakthroughs in FCEV core technologies and industrial applications
14th five-year plan (2021-2025) 2021 Hydrogen listed as a future industry
Medium- and long-term plan for the development of the hydrogen energy industry (2021–2035) 2022 Aims to reach 100,000-200,000 tonnes of green hydrogen production [this target has been met]. Also aims to get 50,000 FCEVs on the road by 2025, leading to a “diversified” hydrogen industry by 2035
Opinions on accelerating the comprehensive green transformation of economic and social development 2024 Promotes further development of hydrogen production, transport, storage and applications
Implementation plan for accelerating the application of clean and low-carbon hydrogen in the industrial sector 2025 Outlines tasks to promote use of low-carbon hydrogen to reduce emissions in heavy industries, such as steel and chemicals
Energy law 2025 Sees hydrogen included in national legislation for the first time, re-classifies it from a hazardous chemical to an energy carrier
15th five-year plan (2026-2030) 2026 Again lists as a future industry, and calls for the development of green fuels derived from green hydrogen
Notice on the implementation of pilot projects for the comprehensive application of hydrogen energy 2026 Provides subsidies to projects to reduce hydrogen costs to 15-25 yuan/kilogram ($2.20-3.67/kg) and help develop a fleet of 100,000 FCEVs

Key policies in the development of China’s hydrogen sector.

In addition, the NEA said in 2025 that local governments across China had issued more than 560 hydrogen-related energy policies by the end of 2024. 

Tu notes that these local policies cover everything from permitting reforms and pipeline planning to exempting FCEVs from paying road toll.

Different provinces across China adopt distinct strategies for developing hydrogen industries, based on local conditions, says the US-based Center on Global Energy Policy, such as energy mix, availability of coal and industrial needs.

However, these local policies and targets are frequently more ambitious than the “conservative” national-level targets, it adds.

Could a new pilot programme boost hydrogen’s prospects?

A new pilot programme, announced in March 2026, aims to commercialise the country’s hydrogen industry by funding projects to reduce the cost of the fuel to 15-25 yuan/kilogram ($2.20-3.67/kg) by 2030, as well as other targets.

Unlike the 2020 subsidies, which focused on FCEVs, the new programme reaffirms China’s interest in a broader series of sectoral applications for hydrogen, including in clean heating, production of low-carbon iron and steel, and production of “green fuels” and other chemicals.

This new pilot is the “strongest financial instrument ever released for China’s green hydrogen application” in terms of creating a comprehensive hydrogen policy that covers a broad swathe of the economy, supporting it with financial backing and targeting application scenarios, Yu says.

However, she argues that strict grant caps – 240m yuan ($35m) per project and 1.6bn yuan ($235m) per selected region across only five regions – limited the overall funding scale available to the industry.

Energy Iceberg has calculated that only around 60-70 projects nationally could receive funding under the current rules, out of more than 670 active green hydrogen proposals in China.  

Shen agrees that the pilot programme is significant and that it will expand the use of hydrogen in China’s climate strategy, particularly green hydrogen.

She notes a provision that “explicitly states that coal-based ammonia and methanol projects cannot be labelled as ‘green’ ammonia or methanol”, suggesting that policymakers are increasingly paying attention to the “integrity” of definitions for hydrogen and hydrogen-derived fuel. 

The “real value” of the pilot scheme, says Tu, is that it focuses on developing “integrated city-cluster ecosystems linking supply, transport, infrastructure and end-use demand”, rather than only supporting individual projects.

This “should help identify viable business models, accelerate cost discovery and concentrate support on applications with stronger scale potential”, as well as boost investor confidence, adds Tu. 

However, he continues that the broader effect it will have on boosting production of hydrogen will “depend on how quickly the selected clusters can translate the programme into real offtake and lower delivered hydrogen prices”.

How does this compare to China’s EV policy push?

The debate around the viability of hydrogen is reminiscent of critiques of EVs.

Until recently, EVs were seen as too expensive for consumers, inefficient and challenging to use without supporting infrastructure. As a result, many western automakers chose to temper their focus on EVs, while continuing to develop internal combustion engines.

However, China has managed to develop a competitive EV industry with products that top global sales.

Part of the playbook that spurred China’s success on EVs included consistent policy signalling in favour of the technology, including mentions in high-level documents and committing resources to building charging infrastructure.

“The defining features of China’s industrial-policy success are its persistence and adaptability,” says Kyle Chan, fellow at the Brookings Institution, adding that “long before the technology and economics of EVs and batteries were proven, China was making long-term investments and policy bets [in the sectors]”.

More tangible measures included direct and indirect subsidies and policy support in the shape of favourable loan rates and low-cost land. One estimate by US-based thinktank the Center for Strategic and International Studies (CSIS) pegs the amount of support allocated to the EV industry between 2009-2023 at $230.9bn.

This coupled with the success of private Chinese manufacturers in creating innovative, nimble companies that “forc[ed] policymakers to adapt”, as well as growing links between the automotive and information technology industries, according to a separate CSIS report.

But this progress on EVs also reportedly came with significant fraud. In 2016, one investigation found that 33 companies were involved in subsidy fraud totalling 9.2bn yuan ($1.3bn).

(It should also be noted that profitability in the industry lags far behind the average for downstream industrial sectors, according to the Hong Kong-based South China Morning Post, which says that “only a handful” of nearly 50 EV makers have reported profits.)

Being the subject of an industrial policy push alone does not guarantee success, states CSIS. It says the strength of the EV industry “was neither inevitable nor the result of a single master plan” and that China’s aims to develop globally-competitive industries in areas such as commercial aviation remain unaccomplished.

China’s approach to hydrogen has been markedly different.

Instead of offering blanket subsidies, the fuel cell demonstration programme it established in 2020 focused on performance-based rewards.

To avoid the subsidy issues seen in the solar and EV industries, the ministry of finance deliberately chose this indirect funding model, says Yu.

However, Yu argues, the programme did not work as well as hoped, due to the funding ceiling and the siloed attempts made by different regional governments to develop hydrogen ecosystems . 

But Chinese policy thinking is becoming more selective and pragmatic for hydrogen compared with EVs, says Shen. She says:

“Electrification remains the primary decarbonisation pathway [for road transport], while hydrogen is increasingly positioned for applications where direct electrification is more difficult.”

Tu echoes this, adding that China is “clearly moving toward a more supportive policy environment for hydrogen”. 

But its approach is “unlikely to replicate the EV story one-for-one”, he adds.

China’s concerted hydrogen push is also unlikely to echo the EV story at a global level, according to the IEA.

In terms of green hydrogen, around 60% of global electrolyser manufacturing capacity is currently in China, prompting concerns from the EU about a repeat of China’s global dominance in the solar and EV sectors.

However, the IEA says, electrolysers made in China “might not supply other markets at scale in the short term”, due to difficulties transporting the bulky technology globally, expectations that costs will only fall gradually, uncertainty around global demand and questions over how well Chinese electrolysers perform against global alternatives.

China’s industrial focus on hydrogen is centred more on domestic use, Shen argues. “It is less about near-term export competitiveness and more about building domestic industrial ecosystems,” she says.

Categories
Energy

Analysis: China’s new carbon metric leaves Germany-sized gap in its emissions

A major change in the way that China measures its core climate goal has effectively halved the growth in the country’s carbon dioxide (CO2) emissions over the past five years.

The revised measure of “carbon intensity”, the amount of CO2 per unit of economic output, implies that China’s emissions have only gone up by 7% from 2020-2025.

This is just half of the 14% rise indicated by previous official statistics.

On paper, the revision creates a gap of 700m tonnes of CO2 (MtCO2) per year, equivalent to the total emissions of Germany or South Korea.

While China has never officially defined how it measures carbon intensity, it has now made what appears to be a retrospective change, with the effect of making targets easier to meet.

The shift means that China officially came close to meeting its carbon-intensity target for 2020-2025, whereas official statistics had previously pointed towards falling well short.

The new definition of carbon intensity has not been made public, but plausible approaches to calculating the metric do not seem to be sufficient to explain the Germany-sized gap.

The apparent gaps or inconsistencies in China’s new carbon accounting also mean that China could meet its international climate pledges for 2030, even if its emissions go up, whereas the previous measure would have required them to fall.

This article explains how the metric appears to have shifted, what changes might potentially explain the revision and what the revised measure implies for China’s climate goals.

Measuring carbon intensity

Reducing carbon intensity – CO2 emissions per unit of GDP – has been China’s key climate commitment since the Copenhagen climate conference in 2009.

At that time, the country pledged to cut its carbon intensity to 48% below 2005 levels by 2020. This was followed up by a 2030 target of a 60-65% reduction, announced in 2014, which was then upgraded to more than 65% in 2021.

Since carbon intensity was made a key progress indicator in China’s 14th five-year plan for 2021-25, the country has reported reductions in carbon intensity every year in its statistical communique, issued at the end of February.

Neither China’s international climate pledges (its nationally determined contributions, NDCs) nor other official documents have ever set out a definition of carbon intensity, despite it being a cornerstone of the country’s climate commitments.

However, until this year, it was possible to closely reproduce the reported numbers, based on a straightforward interpretation of what carbon intensity means.

But the types of emissions that are included in the carbon-intensity metric have now changed.

Previously, it was possible to reproduce the reported carbon-intensity data by combining official GDP data with estimates of emissions from the use of fossil fuels. The latter could be estimated based on the officially reported consumption of coal, oil and gas, multiplied by China’s official emissions factors for the CO2 per unit of energy from each fuel.

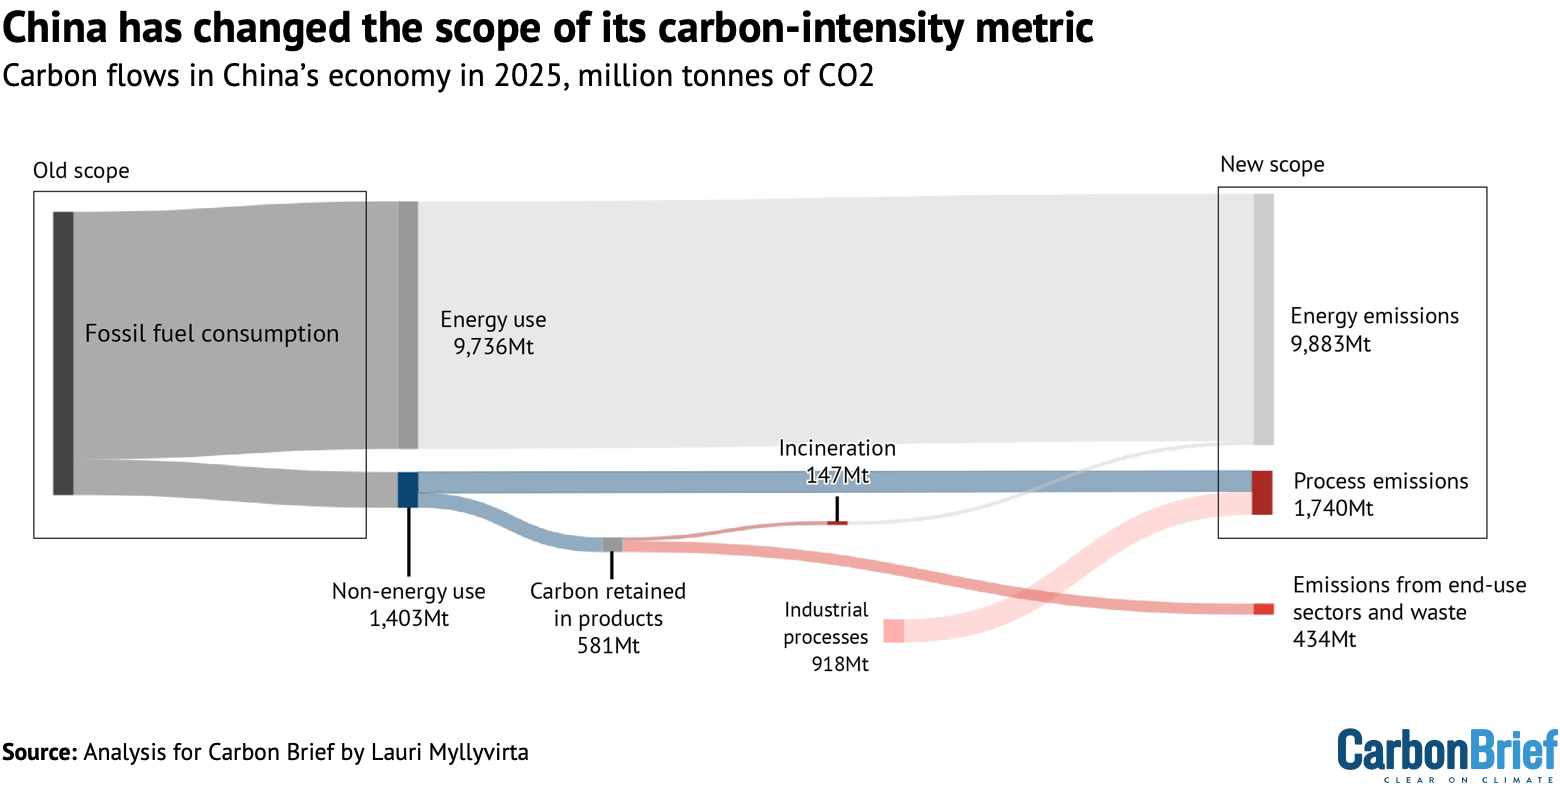
The previous carbon-intensity measure apparently included emissions from the use of fossil fuels to generate energy, as well as their use as chemical feedstocks, so-called “non-energy uses”. However, it did not include non-fossil fuel CO2 emissions from industrial processes, such as the production of cement, as shown by the “old scope” in the figure below left.

Chart showing that China has changed the scope of its carbon-intensity metric
Old and new scopes of China’s CO2 emission reporting from fossil-fuel use and industrial processes. Source: Analysis for Carbon Brief by Lauri Myllyvirta. See “about the data” for further details.

Based on the annually reported progress against this old scope, China’s carbon intensity had fallen by a total of 12.4% from 2020-2025.

This was well short of the 18% target set for these years under the 14th five-year plan.

In September 2025, Huang Runqiu, head of the Ministry of Ecology and Environment, acknowledged this gap, saying that meeting China’s carbon-intensity targets had become “more challenging” due to the effects of the Covid-19 pandemic and trade tensions.

Yet the 15th five-year plan, published in March 2026, reported that China had cut its carbon intensity by 17.7% over the same period – just shy of the 18% target.

As such, it is clear that there has been a major shift in the way that China measures its carbon intensity, specifically in terms of which types of emissions are included.

Moreover, the revised numbers imply that – rather than missing it by a large margin – China officially came close to meeting its carbon-intensity target for the 14th five-year plan.

A footnote in China’s latest statistical communique offers a brief description of carbon intensity as relating to the CO2 emissions from “energy activities and industrial production”.

This indicates that the carbon-intensity calculation now includes industrial process emissions and excludes non-energy uses of fossil fuels, shown by the “new scope” in the figure above.

In comments sought by Carbon Brief, Ryna Cui, associate research professor at the University of Maryland School of Public Policy, who was not involved in the analysis, agrees that the changes to the carbon-intensity methodology are “unclear”. However, she notes that “limited data” makes it challenging to fully verify the nature and impact of the changes.

The revision mirrors a recent change made to the way that China measures its “energy intensity”, the energy use per unit of economic output. In 2024, energy intensity was changed to exclude non-energy use of fossil fuels and energy use from non-fossil fuels.

This exclusion also created a major incentive for expanding the chemical industry and the non-energy use of fossil fuels.

As for the change in carbon-intensity metric, this follows the highly energy-intensive pattern of economic growth during and after the Covid-19 pandemic and China’s “zero-Covid” policy.

Germany-sized gap

The shift in the way that China is measuring its carbon intensity has implications for estimates of the country’s emissions, which are only reported officially some years later.

Changes in carbon intensity and GDP are reported far more quickly – and can be used to estimate changes in China’s CO2 emissions.

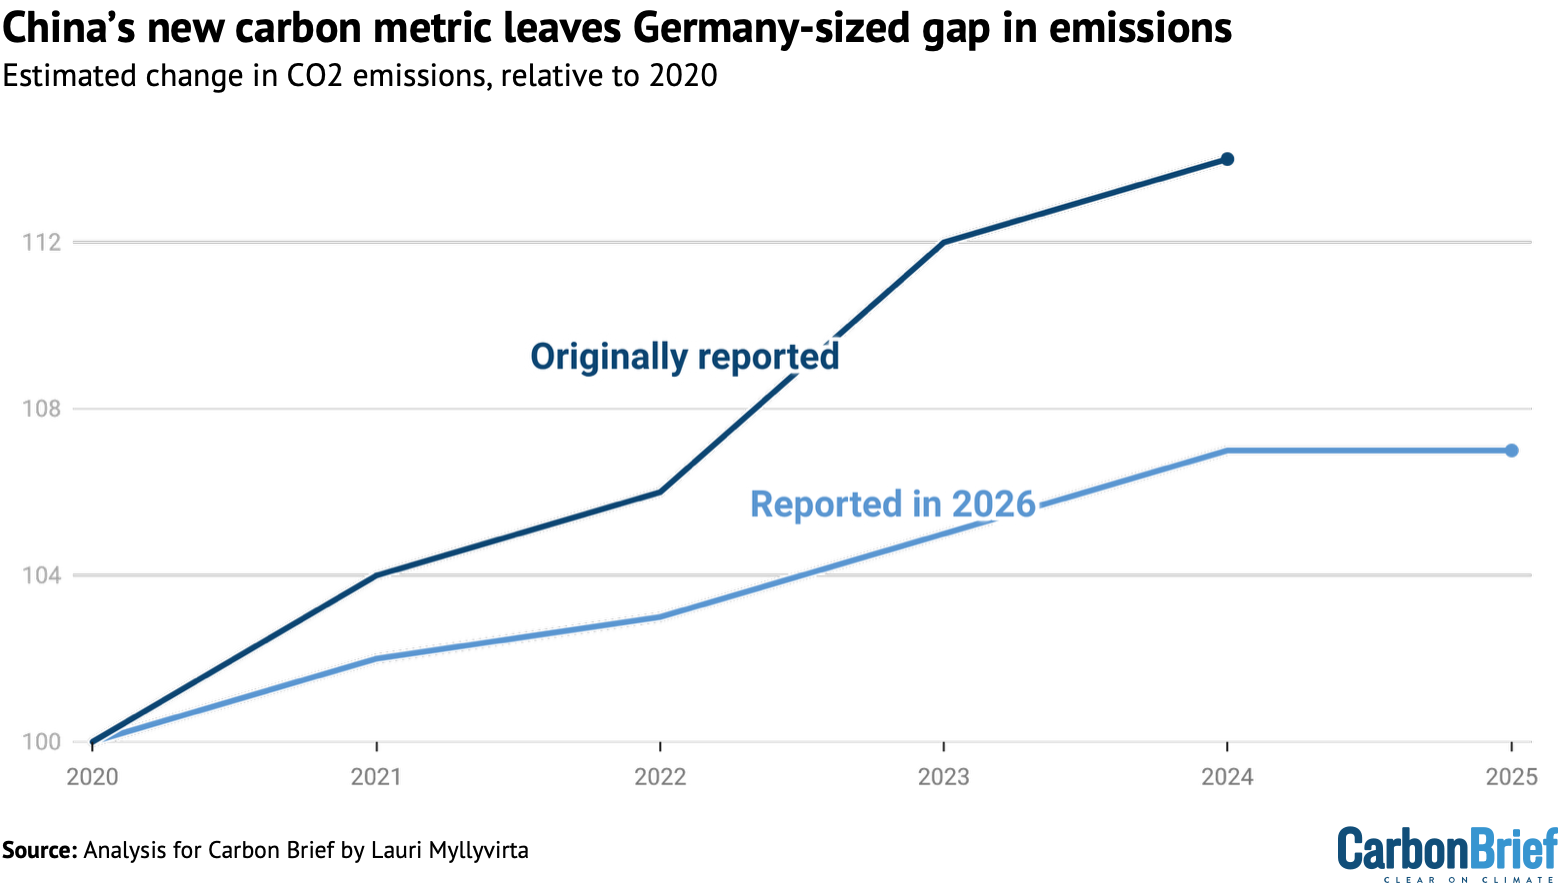
China’s total emissions from energy and industrial processes were 11.2bn tonnes of CO2 (GtCO2) in 2020. Based on the originally reported changes in carbon intensity and GDP, its fossil-fuel CO2 emissions had grown 14% by 2024, an increase of 1,430m tonnes (MtCO2).

In contrast, the newly reported carbon-intensity figures imply that China’s CO2 emissions only grew by 7% between 2020 and 2025, up just 690MtCO2, as shown by the figure below.

The gap between these figures amounts to 730m tonnes of CO2 (MtCO2), equivalent to the annual emissions of Germany or South Korea.

Chart showing that China's new carbon metric leaves Germany-sized gap in emissions
Estimated annual changes in China’s CO2 emissions, relative to 2020=100. Blue line: Estimate based on originally reported changes in carbon intensity. Red: Based on changes reported in 2026. Source: Analysis for Carbon Brief by Lauri Myllyvirta. See “about the data” for further details.

On paper, therefore, the change in the carbon-intensity metric effectively halves the rate of growth in China’s CO2 emissions over the past five years.

Decoding the new carbon-intensity methodology

The change in the carbon-intensity metric could have other significant implications, explored below, making it important to understand how it is being calculated.

Yet, while there are some indications of what the new approach entails, these changes do not seem to account for the magnitude of the revision.

The new scope includes industrial-process emissions. One of the largest sources of these emissions, the cement industry, has been contracting due to a slowdown in real estate and infrastructure construction.

This reduction in emissions is one reason why China’s carbon intensity has improved more quickly under the new scope than under the old one.

In addition, the new scope excludes non-energy use of fossil fuels – largely relating to the chemicals industry – where there has been rapid growth over the past five years.

This is another factor in carbon intensity improving faster under the new scope.

Indeed, China’s chemicals industry drove more than half of the growth in its total fossil-fuel use in the past five years, including 40% of coal use and all of oil use. As a result, non-energy use reached 13% of the total consumption of fossil fuels in 2025, up from 7% in 2020, after growing at an average annual rate of 13%.

The figure below illustrates the impact of these changes in scope. It shows the change in China’s emissions from 2020-2025 due to the use of fossil fuels for energy, its industrial-process emissions and non-energy use of fossil fuels.

The first few rows show changes based on the consumption of fossil fuels overall, amounting to a combined 1,430MtCO2 rise in emissions.

This compares with the 690MtCO2 rise implied by the new carbon-intensity metric, leaving that Germany-sized 730MtcO2 gap in emissions. The new scope explains some of this gap.

In terms of industrial processes, the 30% fall in cement production could account for a 300MtCO2 fall in China’s CO2 emissions. In addition, the amount of carbon stored in products, such as plastics, asphalt and rubber, could account for an estimated 100MtCO2 fall in emissions.

On the other hand, emissions from the incineration of plastics increased by an estimated 40% and from metals industry processes by 10%, with aluminium production having expanded by 21%. Together, these would have increased emissions by an estimated 60MtCO2.

In total, the changes in emissions from fossil-fuel use, industrial processes, carbon retained in products and waste incineration add up to a combined 1,070MtCO2 rise from 2020-2025, shown in the penultimate row of the figure below.

Again, this revised total – based on the change in scope of the carbon-intensity metric – goes some way to explaining the Germany-sized gap in China’s CO2 emissions.

However, the new carbon-intensity figures imply that China’s CO2 emissions only increased by 690MtCO2, as shown in the final row of the figure below. This leaves a residual gap of around 380MtCO2, which does not appear to be accounted for by the data available.

Chart decoding China's new carbon-intensity metric
Changes in China’s emissions by source from 2020-2025, MtCO2. Source: Analysis for Carbon Brief by Lauri Myllyvirta. See “about the data” for further details.

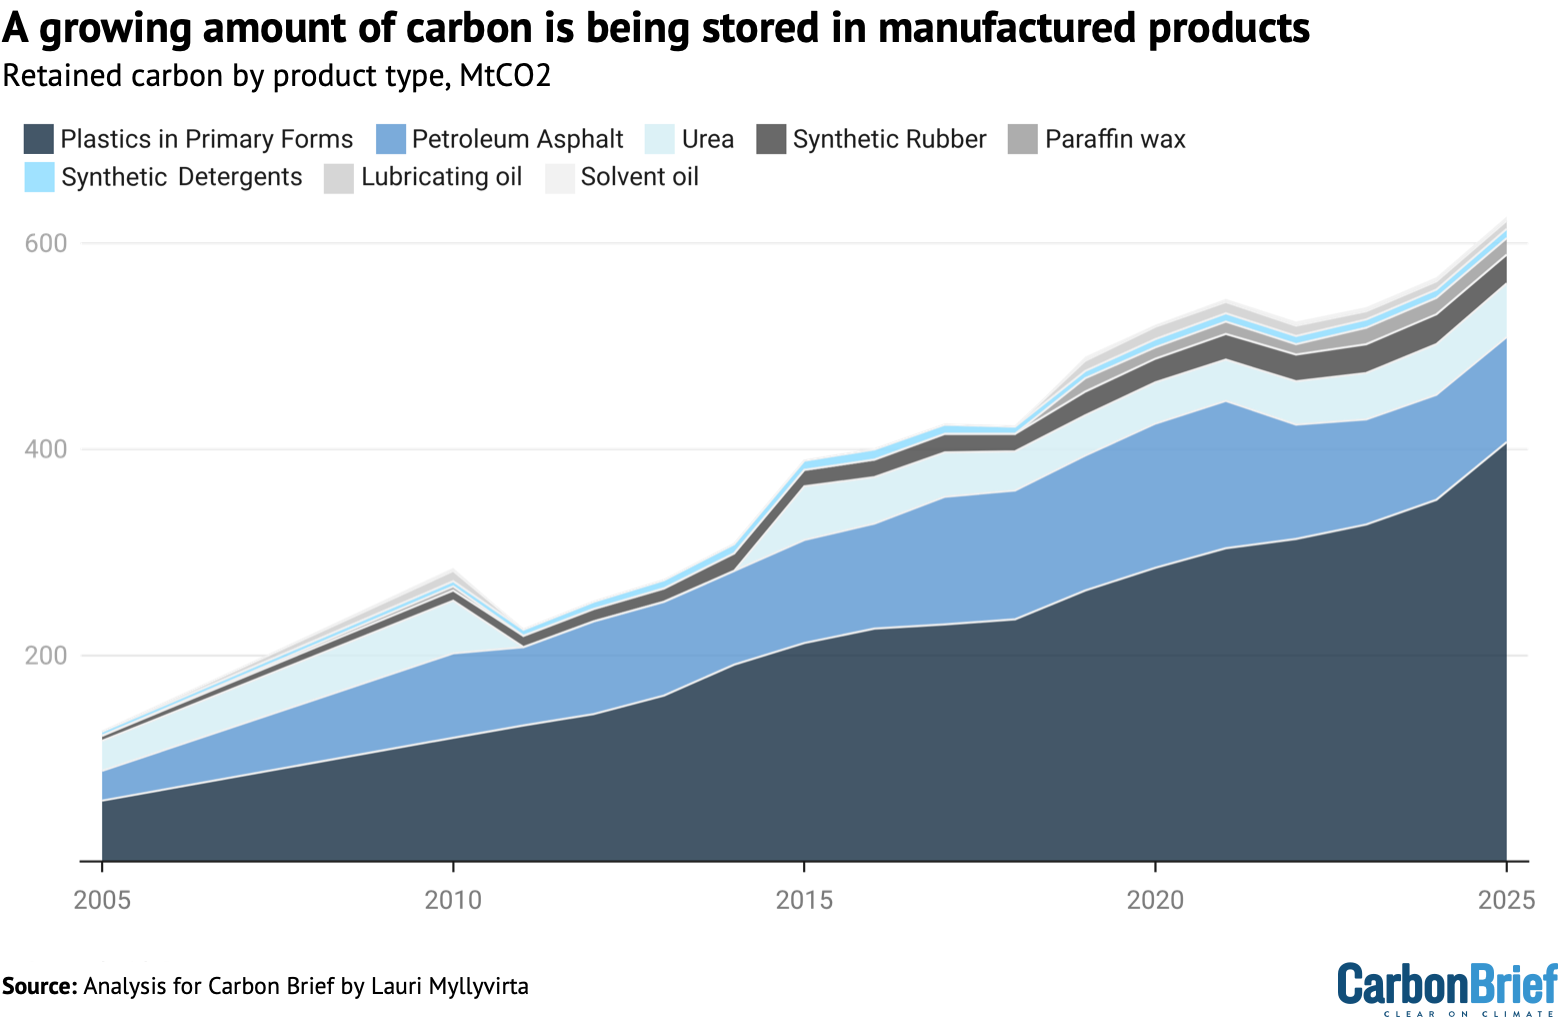
One way to make the numbers add up would be to assume that the amount of carbon embedded in chemical-industry products has increased by the equivalent of 500MtCO2.

However, the reported output of major chemical-industry products cannot account for this level of embedded carbon. The figure below shows that the increase in output of major chemical products only explains around a 110MtCO2 increase in retained carbon.

Much of the increase in the production of plastics was cancelled out by a contraction in the use of bitumen for asphalt, due to lower road-building activity.

Chart showing that a growing number of carbon is being stored in manufactured products
The amount of carbon retained in products from 2005-2025, MtCO2. Source: Analysis for Carbon Brief by Lauri Myllyvirta. See “about the data” for further details.

Furthermore, the 14th five-year plan for 2021-25 had a target of raising the share of waste incineration to 65% of urban residential waste treatment capacity, up from 45% in 2020.

So, while plastics production did go up, resulting in increased amounts of retained carbon, a larger share of this retained carbon was being incinerated, meaning its carbon would quickly be released back into the atmosphere.

One reason why carbon retained in products has grown more slowly than the amount of fossil fuels used in chemicals production is that the fastest growth has been in the coal-based chemicals industry.

Coal-based processes have a much lower conversion efficiency than oil- and gas-based production, with process emissions that are typically multiple times as high.

For example, these emissions are 10 times as high for the production of olefins – a key plastics feedstock – from coal as compared with oil or gas. The process is reported to require 3.75 tonnes of standard coal per tonne of product. This implies that only 30% of the carbon in the coal is retained in the product, with the other 70% being emitted in the process.

There are also chemical processes that use fossil fuels as a feedstock, but where the end product does not contain carbon. One example is ammonia, a key building block for fertiliser, where production grew by 52% from 2020 to 2025.

Neither the change in scope of the carbon-intensity calculation, nor the change in the amount of carbon retained in products, is sufficient to explain the size of the revision in the newly reported numbers. There must be another explanation.

There are two options. Either the new scope broadly aligns with what is outlined above, but also excludes a subset of the CO2 emissions. Or the scope does not exclude any of the CO2, but there are gaps in the monitoring of some energy or industrial-process emissions.

Either explanation would mean that China is not accounting for some of its CO2 emissions. It would also mean that the improvement in carbon intensity for 2020-2025 is over-reported.

China’s latest officially reported emissions inventories reinforce the second of the two options above, namely, that there are gaps in emissions reporting from the chemical industry.

From 2018 to 2021, the latest year for which China has reported on its emissions, the CO2 output of chemical-industry processes only increased by 13%. Over the same period, non-energy use of fossil fuels increased by 29%, according to data reported to the International Energy Agency by the Chinese government.

One factor in these apparent gaps could be that China’s National Bureau of Statistics (NBS) is required to publish data on carbon intensity very quickly, since it is a key indicator in the country’s five-year plans.

On the other hand, detailed greenhouse gas emissions inventories and energy statistics are only published years later, by the environment ministry and NBS, respectively.

What the change means for China’s targets

The change in the definition of carbon intensity has the effect of weakening China’s climate targets and introducing more uncertainty into tracking progress.

On the basis of China’s new numbers, it will require less effort to hit the 2030 target for a 65% reduction in carbon intensity on 2005 levels, as per China’s Paris pledge.

This target can now be met even if CO2 emissions go up between 2025 and 2030, whereas the previous metric would have required a reduction.

It will also require less effort to hit the 17% target in the 15th five-year plan. 

The apparent gaps in the CO2 emissions numbers for 2025 could affect the delivery of China’s other key climate pledges, such as the commitment to peak CO2 emissions before 2030. They could also allow the chemical industry’s CO2 emissions to continue climbing rapidly, while still officially meeting the 2030 goals for CO2 intensity.

Moreover, the apparent gaps or inconsistencies in China’s new carbon accounting also mean that China would be able to officially meet its target to peak its CO2 emissions by 2030, even if its overall CO2 emissions do not actually reach a peak.

The apparent gaps could also affect the delivery of China’s newer target to cut its greenhouse gas emissions to 7-10% below peak levels by 2035 and beyond.

Nevertheless, researchers and analysts can still monitor progress by calculating China’s CO2 emissions independently.

China’s reporting on fossil-fuel consumption, the output of plastics and other carbon-containing products, as well as manufacturing of commodities with substantial process emissions, provides a basis for tracking emissions under the new scope.

While under the UN’s climate framework China is free to use any definition it wants to meet its own nationally determined climate pledges, retrospective changes to methodology or inconsistent accounting could erode the value of the country’s commitments.

Moreover, it will, ultimately, have to close any gaps in its emissions data and reporting, under the transparency rules of the Paris Agreement.

China’s next transparency report to the UN, due by the end of this year, should also provide more clarity on the methodology and data underlying the revised numbers.

This underscores the importance of monitoring, reporting and verification for industrial process emissions. “Mass balances” based on fossil-fuel consumption and product output could be used as a check on CO2 emissions reporting. Finally, China’s emissions data could also be made more granular and clearly defined.

Carbon Brief has approached the National Bureau of Statistics and Ministry of Ecology and Environment for comment.

The University of Maryland’s Cui tells Carbon Brief that in general, China’s climate goals are “improv[ing]” in terms of their coverage and scope. However, she adds:

“The issue is…the ambiguity and inconsistency in the coverage, definition and method between target setting and progress tracking, which can lead to large uncertainties and room for manipulation. It highlights the importance of transparency in national climate targets, following the UNFCCC’s international transparency framework, which should also be applied as best practices for domestic targets.”

About the data

The calculations in this analysis are based on China’s total coal, oil and gas consumption from energy statistical yearbooks covering the years until 2023, with data for 2024 and 2025 taken from the latest statistical communiques.

“Originally reported” CO2 emissions were back-calculated from carbon-intensity reductions and GDP growth given in annual statistical communiques. The revised emissions for 2020, 2024 and 2025 are similarly back-calculated from the reductions in carbon intensity from 2020 to 2025 and from 2024 to 2025, as reported in the 15th five-year plan outline and the 2025 statistical communique, respectively, combined with annually reported GDP growth.

Cement process emissions up to 2024 are from Robbie Andrews’ estimates, scaled to 2025 based on year-on-year change in total cement output.

Process emissions from the metals industry are based on calculating emissions for aluminium, silicon, lead, zinc and crude steel from the bottom-up, using industrial output data and IPCC default emission factors scaled to the reported total in 2021. For steel, the calculations are based on typical quicklime use in basic-oxygen and electric-arc furnaces.

Emissions from the incineration of plastics are based on a peer-reviewed estimate of plastics incineration in 2022, combined with growth rates in the overall power generation from waste-to-energy plants. The analysis assumes that the share of plastics in the energy content of the incinerated waste stayed constant over this period, which is a conservative assumption given the rapid rise in plastics production.

Total non-energy use of fossil fuels in 2020, 2024 and 2025 is available from an NEA data release, with data for 2021-2023 found in the China energy statistical yearbook 2025.

The mix of coal, oil and gas within non-energy use is based on the energy statistical yearbook data up to 2023, with the increase in coal in 2024 and 2025 based on Wind Financial Terminal data on coal consumption in the chemical industry. Gas use, which is relatively minor, is assumed to have grown on trend and oil is calculated as the residual.

Primary plastics, rubber, and urea output data are from NBS industrial statistics. The production of solvents, lubricants and waxes, as well as the use of bitumen in construction, is from energy statistical yearbooks. The analysis assumes no change in output from 2023 to 2025, given the lack of clear trends.

Categories
Energy

Revealed: Floods have forced at least 67 closures at NHS hospitals since 2021

At least 67 NHS hospital wards, departments and other sites across the UK have been forced to temporarily close or relocate due to weather-related flooding over the past five years, a Carbon Brief investigation reveals.

Maternity centres, surgical theatres, a neonatal intensive-care unit and even entire hospital buildings have been disrupted by heavy rainfall or encroaching floodwaters.

Carbon Brief submitted freedom-of-information (FOI) requests to 162 NHS trusts, which show that while many flood-related shutdowns were brief, some lasted for weeks or months. 

In total, 148 trusts responded to these requests with reports of 67 flood-related shutdowns, giving detailed data for 30 incidents that resulted in a total of 3,000 days of closures.

Reports of flooding at NHS sites have been on the rise, according to NHS England data.  

This comes as the UK experiences wetter winters, with periods of extreme rainfall that are increasingly linked to human-caused climate change.

These floods can exacerbate existing problems in a healthcare system that is already struggling with insufficient funding, old hospital buildings and a backlog of maintenance work.

Indeed, while there have been efforts to make UK hospitals more resilient to extreme weather, one expert tells Carbon Brief that such measures are difficult to implement when these institutions are struggling to keep their “heads above water”.

Rising floods

Floods pose a threat to people’s health, but they also threaten the UK’s healthcare infrastructure. Water can enter hospitals, paralyse ambulance services and damage equipment, placing strain on an already stretched NHS.

NHS records show that the number of flood incidents “caused by external weather events” in facilities across England has doubled since 2021, reaching nearly 400 in 2024-25. 

Equivalent data is not available for Scotland, Wales and Northern Ireland, although there have been reports of floods disrupting services across the whole UK.

As global temperatures rise and the atmosphere holds more moisture, UK winters are getting wetter. Attribution studies show climate change has increased the severity of recent rainfall and flooding events – including Storm Eunice in 2022 and Storm Babet in 2023. 

There is also a risk of increased flooding when heavy rain hits after periods of intense drought, of the kind seen in recent years.

Environment Agency modelling suggests that a rising share of medical facilities in England will be at risk of flooding due to climate change. It says the share of sites at risk will increase from a quarter in 2024 to a third by the middle of the century.

Despite this apparent threat facing the UK’s healthcare system, there is limited information about the extent to which these floods are already disrupting NHS services.

Closed services

To build a fuller picture of NHS-wide flooding, Carbon Brief sent FOI requests to 162 trusts and health boards – the organisations in charge of health services – across England, Scotland, Wales and Northern Ireland.

They were asked for details of wards, departments or services that had been temporarily or permanently closed due to weather-related flooding, such as river floods or heavy rainfall, between 2021-22 and the start of 2026.

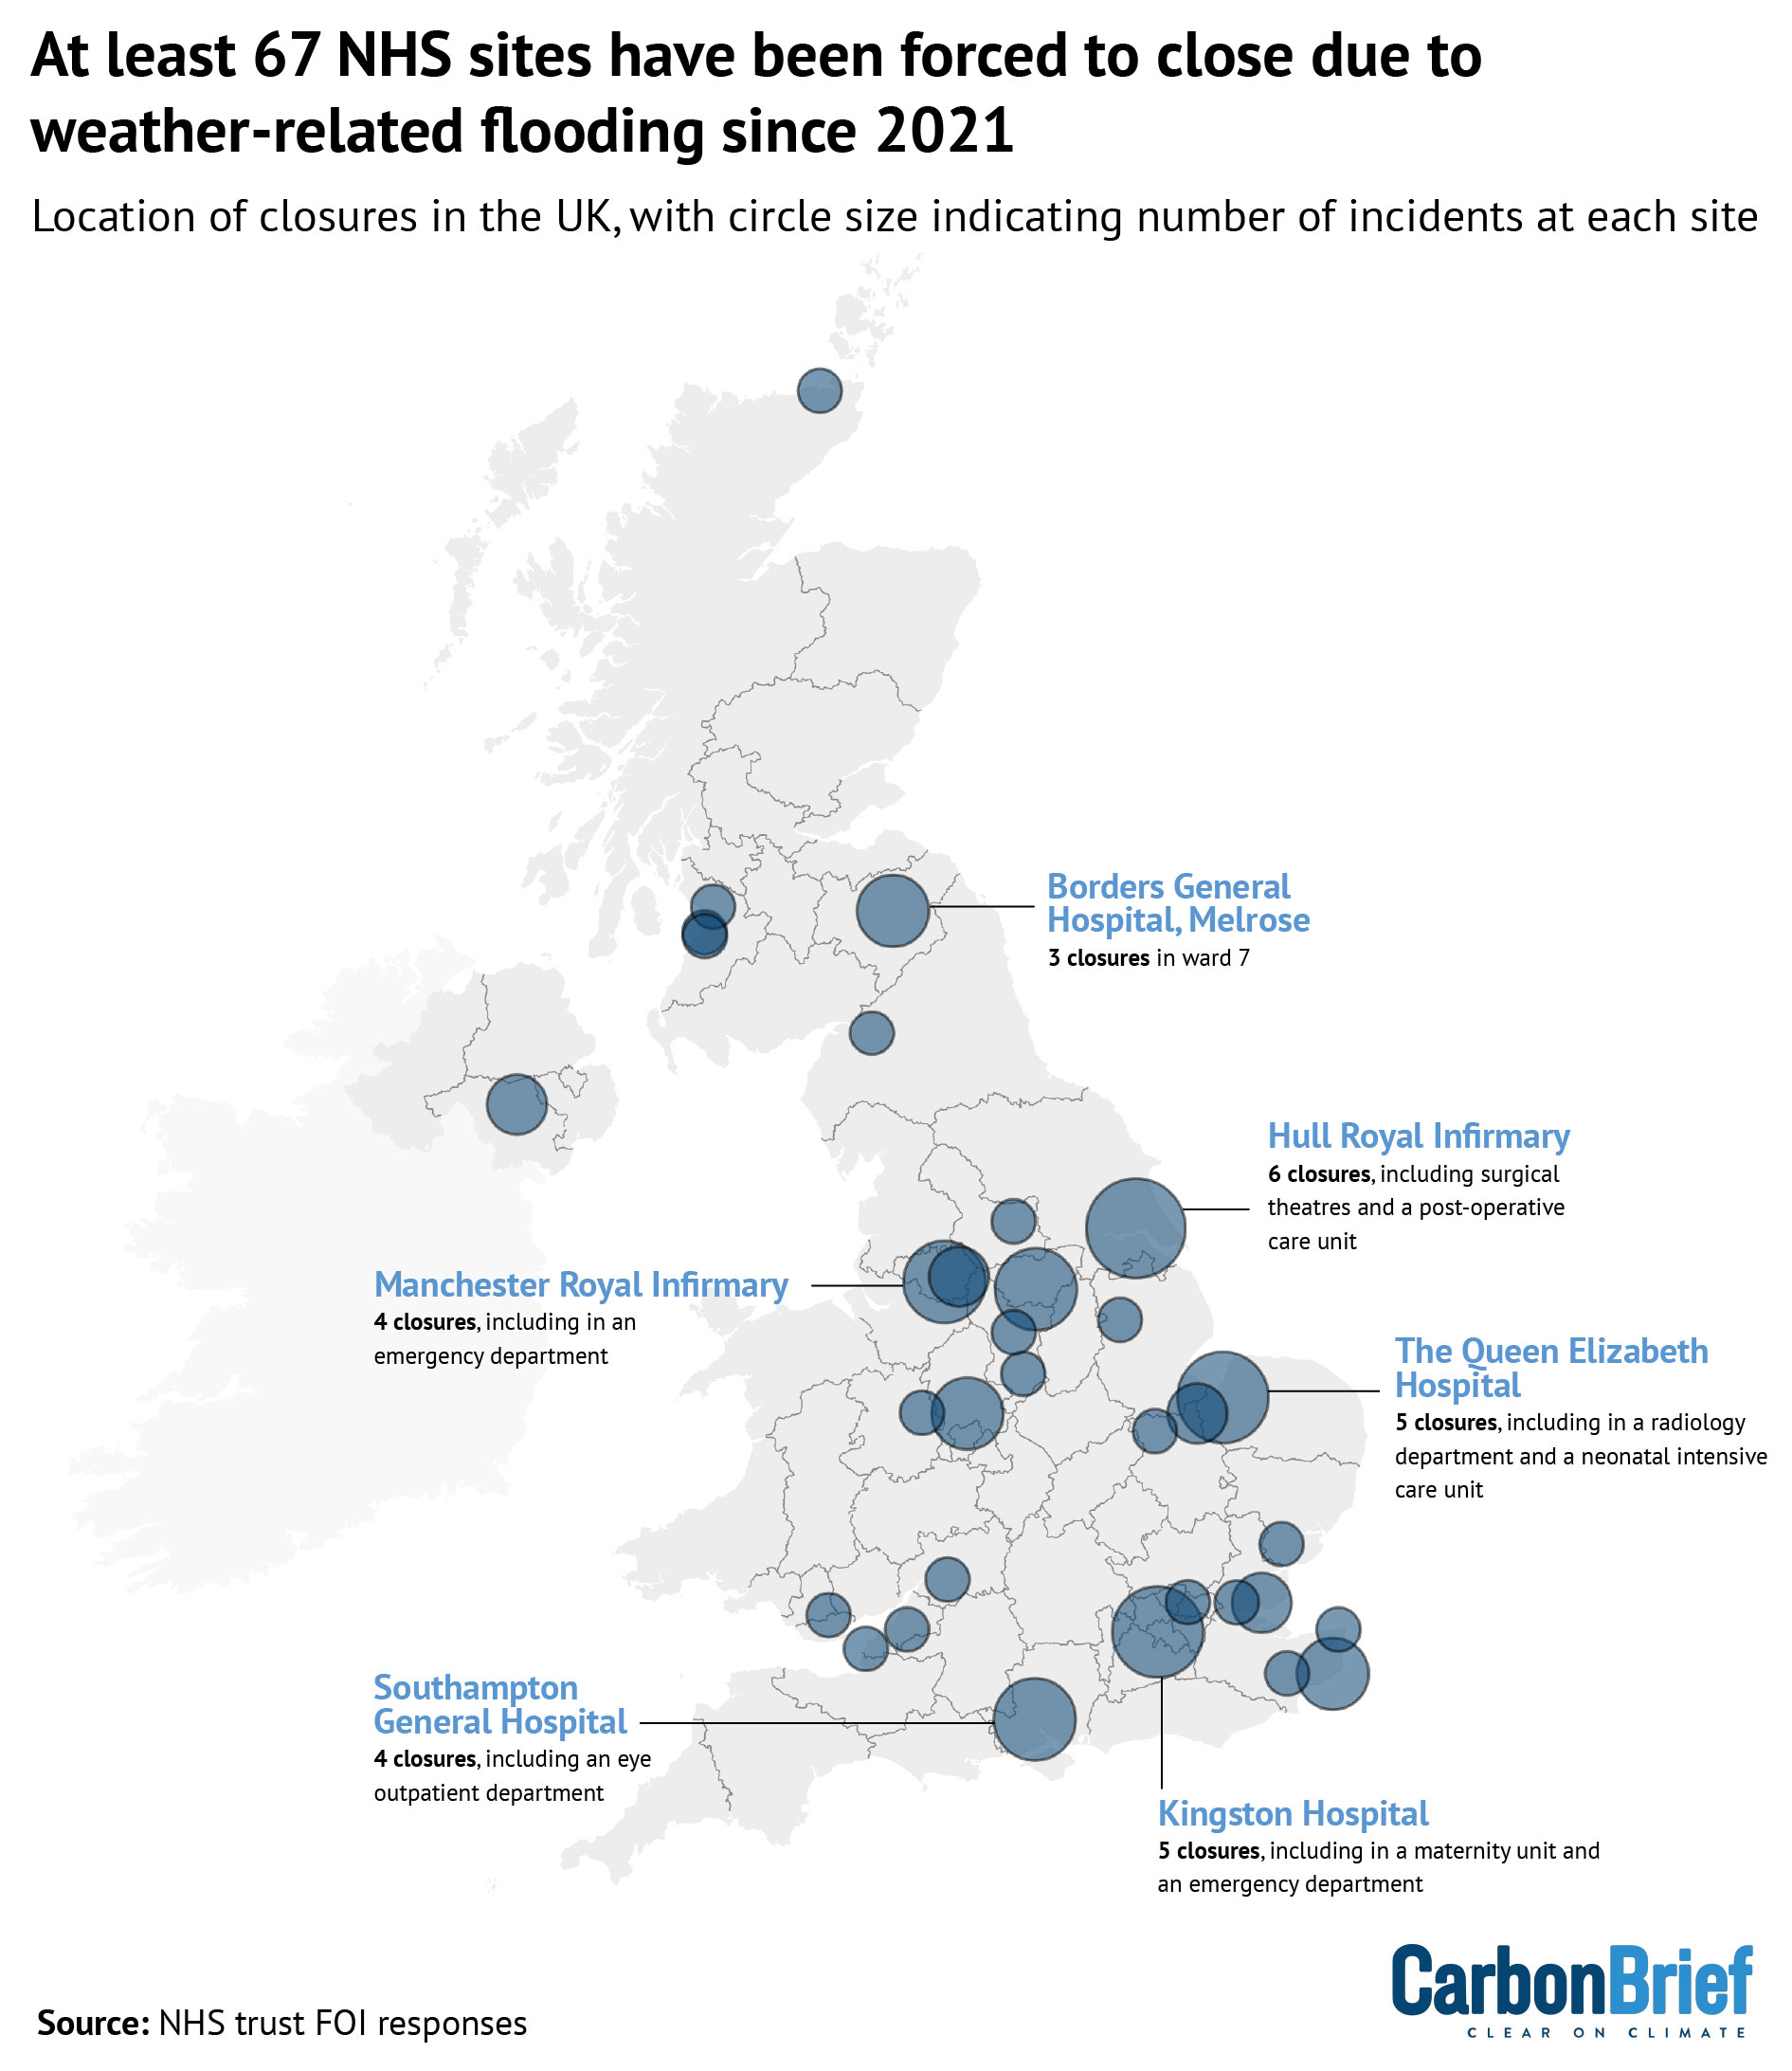
In total, 148 of these bodies responded with details of 67 incidents in which weather-related floods have triggered closures. The map below shows where these incidents were located, from hospital wards in Scotland to an eye unit on the south coast of England.

Map of the UK showing that at least 67 NHS sites have been forced to close due to weather-related flooding since 2021
Sites of weather-related flooding incidents at NHS facilities. The size of the circles indicates the number of incidents reported at each site. Source: NHS trust FOI responses to Carbon Brief.

The 67 flooding-related disruptions reported by NHS trusts and health boards is likely an underestimate. Many trusts told Carbon Brief they did not record such detailed information or that collating it would be too time-consuming.

Nevertheless, the results provide an insight into the kind of risks facing NHS services as weather gets more extreme.

Among the closures were 13 accident and emergency (A&E) departments, urgent treatment centres and minor injuries units. There were also 10 hospital wards, 10 surgical theatres, five maternity units and a neonatal intensive-care unit affected by flooding. 

Many trusts did not provide information about how long each closure lasted. However, the 30 incidents where timespans were provided add up to the equivalent of more than 3,000 days – or eight years – of closures across NHS sites. 

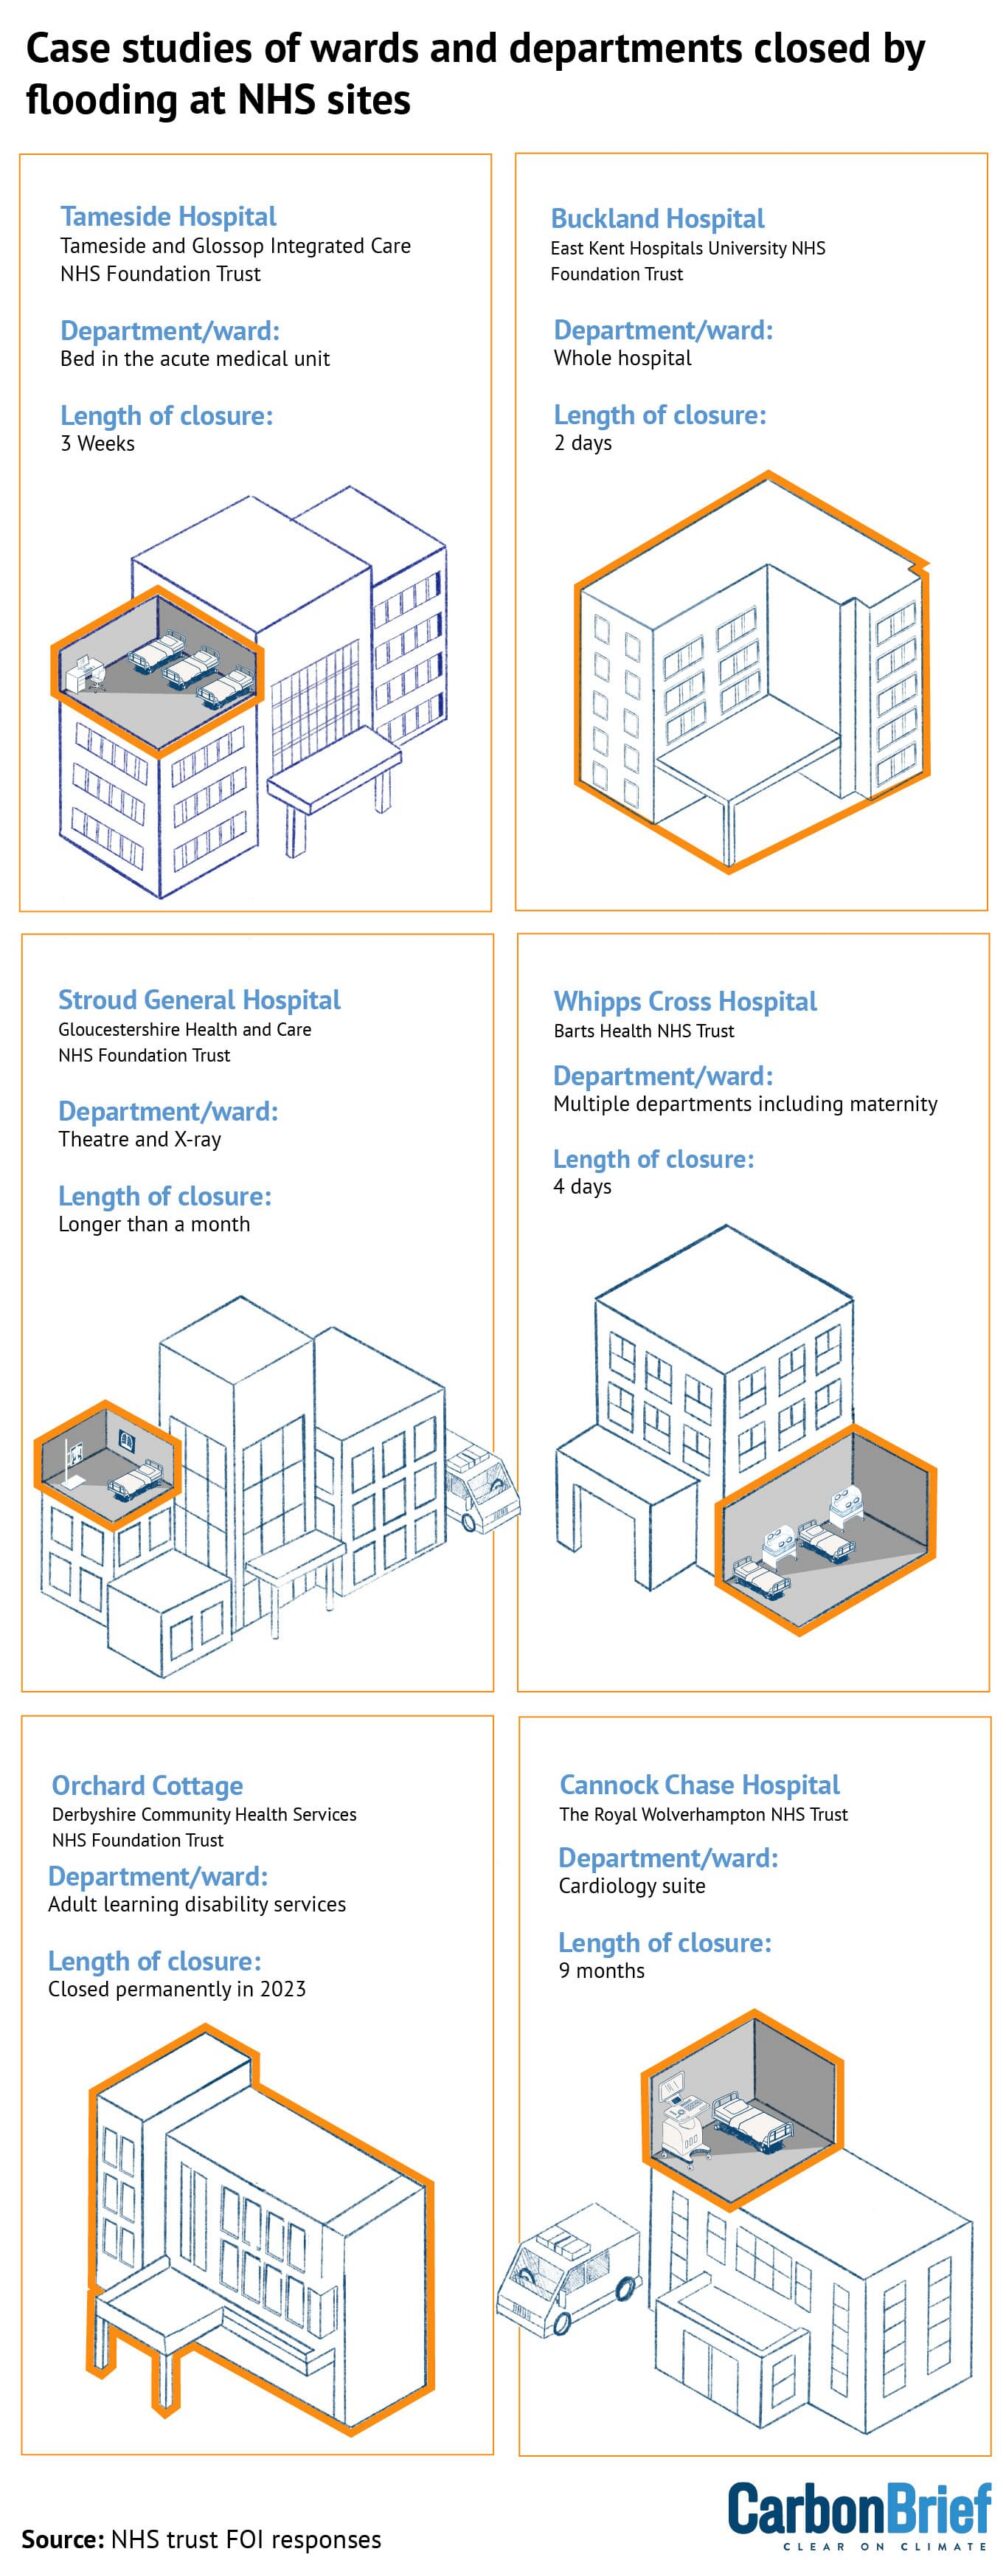
The infographic below provides a snapshot of some notable closures from the dataset.

Notable incidents of weather-related flooding at NHS facilities. Source: FOI responses to Carbon Brief.
Infographic showing case studies of wards and departments closed by flooding at NHS sites
Notable incidents of weather-related flooding at NHS facilities. Source: FOI responses to Carbon Brief.

The entire Buckland Hospital site in Dover closed for two days in 2025 amid “exceptional rainfall” and flash floods. People seeking radiology, maternity and urgent-care services were told not to visit over the weekend and various clinical services were delayed or cancelled.

The NHS declared a “major incident” in 2021 when flood waters “caused power outages impacting multiple areas” at Whipps Cross Hospital in north-east London – including its maternity service – for four days. Neighbouring hospitals also flooded.

Some closures lasted far longer. In Stroud General Hospital, a surgical theatre was closed for two weeks and an X-ray facility for around two months after storm water overflowed into the building in 2023.

Several NHS trusts stressed that the flooding incidents they reported were localised – often resulting from roof leaks exacerbated by heavy rain – and resulted in minimal disruption. Sometimes, as with a cardiology suite in Cannock Chase Hospital, the service was moved and the trust says patient care was not disrupted.

However, the responses also showed the breadth of damage such events can cause, including rainwater “pouring onto expensive equipment” and floods triggering the long-term relocation of services.

For example, Orchard Cottage, a site that provided care for adults with learning disabilities in Derbyshire, experienced major flooding during Storm Babet in 2023 and was permanently shut down as a result.

Adaptation needs

The UK Health Alliance on Climate Change, a group of UK health organisations, concluded in a report in 2025 that, with flood risks projected to grow, there is an “urgent need for adaptation measures” across the nation’s healthcare facilities.

Government advisors at the Climate Change Committee have highlighted the need for flood resilience in UK hospitals, including flood barriers, waterproofed electricals and built-in redundancy for critical areas, such as theatres, labs and IT equipment.

There have been various measures at both government and NHS level intended to improve the resilience of medical facilities to climate-related hazards.

The UK’s national adaptation programme sets out expectations for NHS England to “adapt NHS infrastructure to extreme weather events”. All trusts must have “green plans” in place, which require climate change to be factored into infrastructure decisions, for example, through the creation of drainage systems or green spaces.

Yet, as it stands, three-quarters of UK doctors say their workplaces are not prepared for the impact of extreme weather and nearly half of healthcare workers report that extreme weather has disrupted NHS services in the past five years.

Many hospitals have outdated infrastructure – often predating the founding of the NHS – which was not designed to cope with climate change. Prof Hugh Montgomery, chair of intensive-care medicine at University College London, tells Carbon Brief:

“The hospitals themselves weren’t built for this weather any more than anything else is really – and of course it’s going to get worse, in an exponential function.”

Many of the FOI responses provided to Carbon Brief identified specific building defects, such as roof leaks, which led to the flooding incidents during periods of heavy rainfall. There is a huge – and growing – backlog of maintenance work at NHS hospitals that was estimated in 2024-25 to need repairs costing £15.9bn.

Chris Naylor, a senior fellow at the King’s Fund, a thinktank focusing on health policy, tells Carbon Brief:

“Dealing with some of the backlog maintenance would probably help with climate adaptation as well, because of leaky roofs and all the rest of it. But we do also need to be thinking specifically about climate adaptation within the NHS and making sure there is funding for that.”

Montgomery points out that with trusts “mostly bankrupt” and most hospitals running a deficit, the question remains how to fund such interventions. “They’re struggling to keep their heads above water and they’re losing money,” he says.

Dr Mark Harber, a consultant nephrologist and special adviser on climate change at the  Royal College of Physicians, tells Carbon Brief that hospitals at least need to make plans for extreme weather. This is particularly important for patients in need of time-dependent and life-saving treatments, such as kidney dialysis and chemotherapy.

Harber notes that hospitals, supply chains and transport could all be disrupted by floods:

“You have to have plans in place to deal with that, even if the NHS can’t deal with the flooding risk per se.”

Carbon Brief asked NHS England – which is responsible for the majority of the trusts that reported flooding disruption – for comment, but had not received a response at the time of publication. 

Methodology

The list of incidents reported by trusts can be viewed here.

Carbon Brief sent FOI requests to 120 English NHS trusts that have reported any incidents of flooding since 2021 in NHS England’s Estates Returns Information Collection (ERIC) dataset. This covers around 60% of all English NHS trusts. 

Carbon Brief also filed FOI requests with all 42 of the health boards and trusts in Scotland, Wales and Northern Ireland, which are equivalent to English NHS trusts.  

All trusts and health boards were asked for details of wards, departments or services that have been temporarily or permanently closed due to weather-related flooding, such as river flooding or heavy rainfall. 

This matches the wording used to describe a flooding event in the ERIC system, which requires the reporting of all flood events “caused by external weather events” that trigger a risk assessment by staff. Such external events are distinct from floods caused by other issues that are not related to the weather, such as burst pipes.

In total, 14 trusts did not respond and many more said they did not hold the data requested. Some trusts provided data, but on further questioning stated that the data they provided covered all flooding events and it was not possible to say which were related to weather conditions. These cases have not been included in the final dataset.

Graphics and hero image by Kerry Cleaver

Categories
Energy

Analysis: UK no longer top UN Green Climate Fund donor after latest aid cut

The UK is no longer the top contributor to the UN’s flagship Green Climate Fund (GCF), after the government announced that it only intends to honour half of its most recent pledge.

Amid wider cuts to its climate aid for developing countries, the UK informed the GCF in May that it will reduce its commitment for the 2024-27 period to £815m ($1.1bn).

In doing so, the Labour government is drastically cutting a Conservative pledge of £1.62bn ($2.16bn), hailed by former prime minister Rishi Sunak’s government as “the biggest single funding commitment the UK has made to help the world tackle climate change”.

This “record” pledge also meant the UK became the top GCF funder, after the Trump administration withdrew $4bn in pledged US funds in 2025.

Now, the UK follows the US in becoming the second major donor to cancel substantial funding, leaving aid experts concerned that other developed countries will follow suit.

As the chart below shows, the UK’s total past and promised contributions to the GCF have now dropped below those of Germany, France and Japan.

GCF pledges by top 10 donors. Dark bars indicate pledges from the initial resource mobilisation in 2014
GCF pledges by top 10 donors. Dark bars indicate pledges from the initial resource mobilisation in 2014 and the first replenishment round in 2019, while light blue bars indicate pledges from the second replenishment round in 2023. Source: NRDC GCF pledge tracker.

The GCF is the largest dedicated UN climate fund and is seen as a vital way of raising grant-based climate finance for developing countries. It oversees more than $20bn worth of funding across 354 projects and programmes.

Developed countries, such as the UK, are obliged under the Paris Agreement to provide climate finance. One of the main ways to do this is through specialised climate funds, such as the GCF. 

However, despite countries committing to increase their climate finance over time, progress in scaling up GCF contributions between funding rounds has been gradual.

With its now-revoked £1.62bn pledge in 2023, the UK was among the donors that had increased its GCF pledging compared with the previous 2019 funding round. 

The latest reduction means the UK will now provide around 45% less funding than it did during the 2019 round. This is the biggest reduction between rounds by any major donor, apart from the US.

In an email to the GCF board, reported by the Financial Times, the fund’s executive director Mafalda Duarte said the UK’s actions were “expected to have a material impact on the delivery” of the fund’s projects.

According to the newspaper, Duarte noted that the move came as the UK cuts its overall aid budget in order to “invest more in addressing growing security threats”. 

In March, the UK government announced plans to spend “around £6bn” of its aid budget on climate projects in developing countries over the next three years.

Carbon Brief analysis suggests that this spending amounts to roughly halving the UK’s annual climate finance, when accounting changes and inflation are factored in.

Categories
Energy

Guest post: How CMIP7 will shape the next wave of climate science

Hundreds of scientists in dozens of institutions are embarking on the next phase of the world’s largest coordinated climate-modelling effort.

Climate-modelling groups use supercomputers to run climate models that simulate the physics, chemistry and biology of the Earth’s atmosphere, land and oceans.

These models play a crucial role in helping scientists understand how the climate is responding as greenhouse gases build up in the atmosphere.

For four decades, the Coupled Model Intercomparison Project (CMIP) has guided the work of the climate-modelling community by providing a framework that allows for millions of results to be collected together and compared.  

The resulting projections are used extensively in climate science and policy and underpin the landmark reports of the Intergovernmental Panel on Climate Change (IPCC).

Now, the seventh phase of CMIP – CMIP7 – is underway, with more than 30 climate-modelling centres expected to contribute more than five million gigabytes of data  – so much that downloading it using a fast internet connection would take two and a half years.

Here, we look at what is new for CMIP7, including its model experiments, updated emissions scenarios and “assessment fast track” process.

What is CMIP? 

Around the world, climate models are developed by different institutions and groups, known as modelling centres. 

Each model is built differently and, therefore, produces slightly different results. 

To better understand these differences, CMIP coordinates a common set of climate-model experiments.

These are simulations that use the same inputs and conditions, allowing scientists to compare the results and see where models agree or differ. 

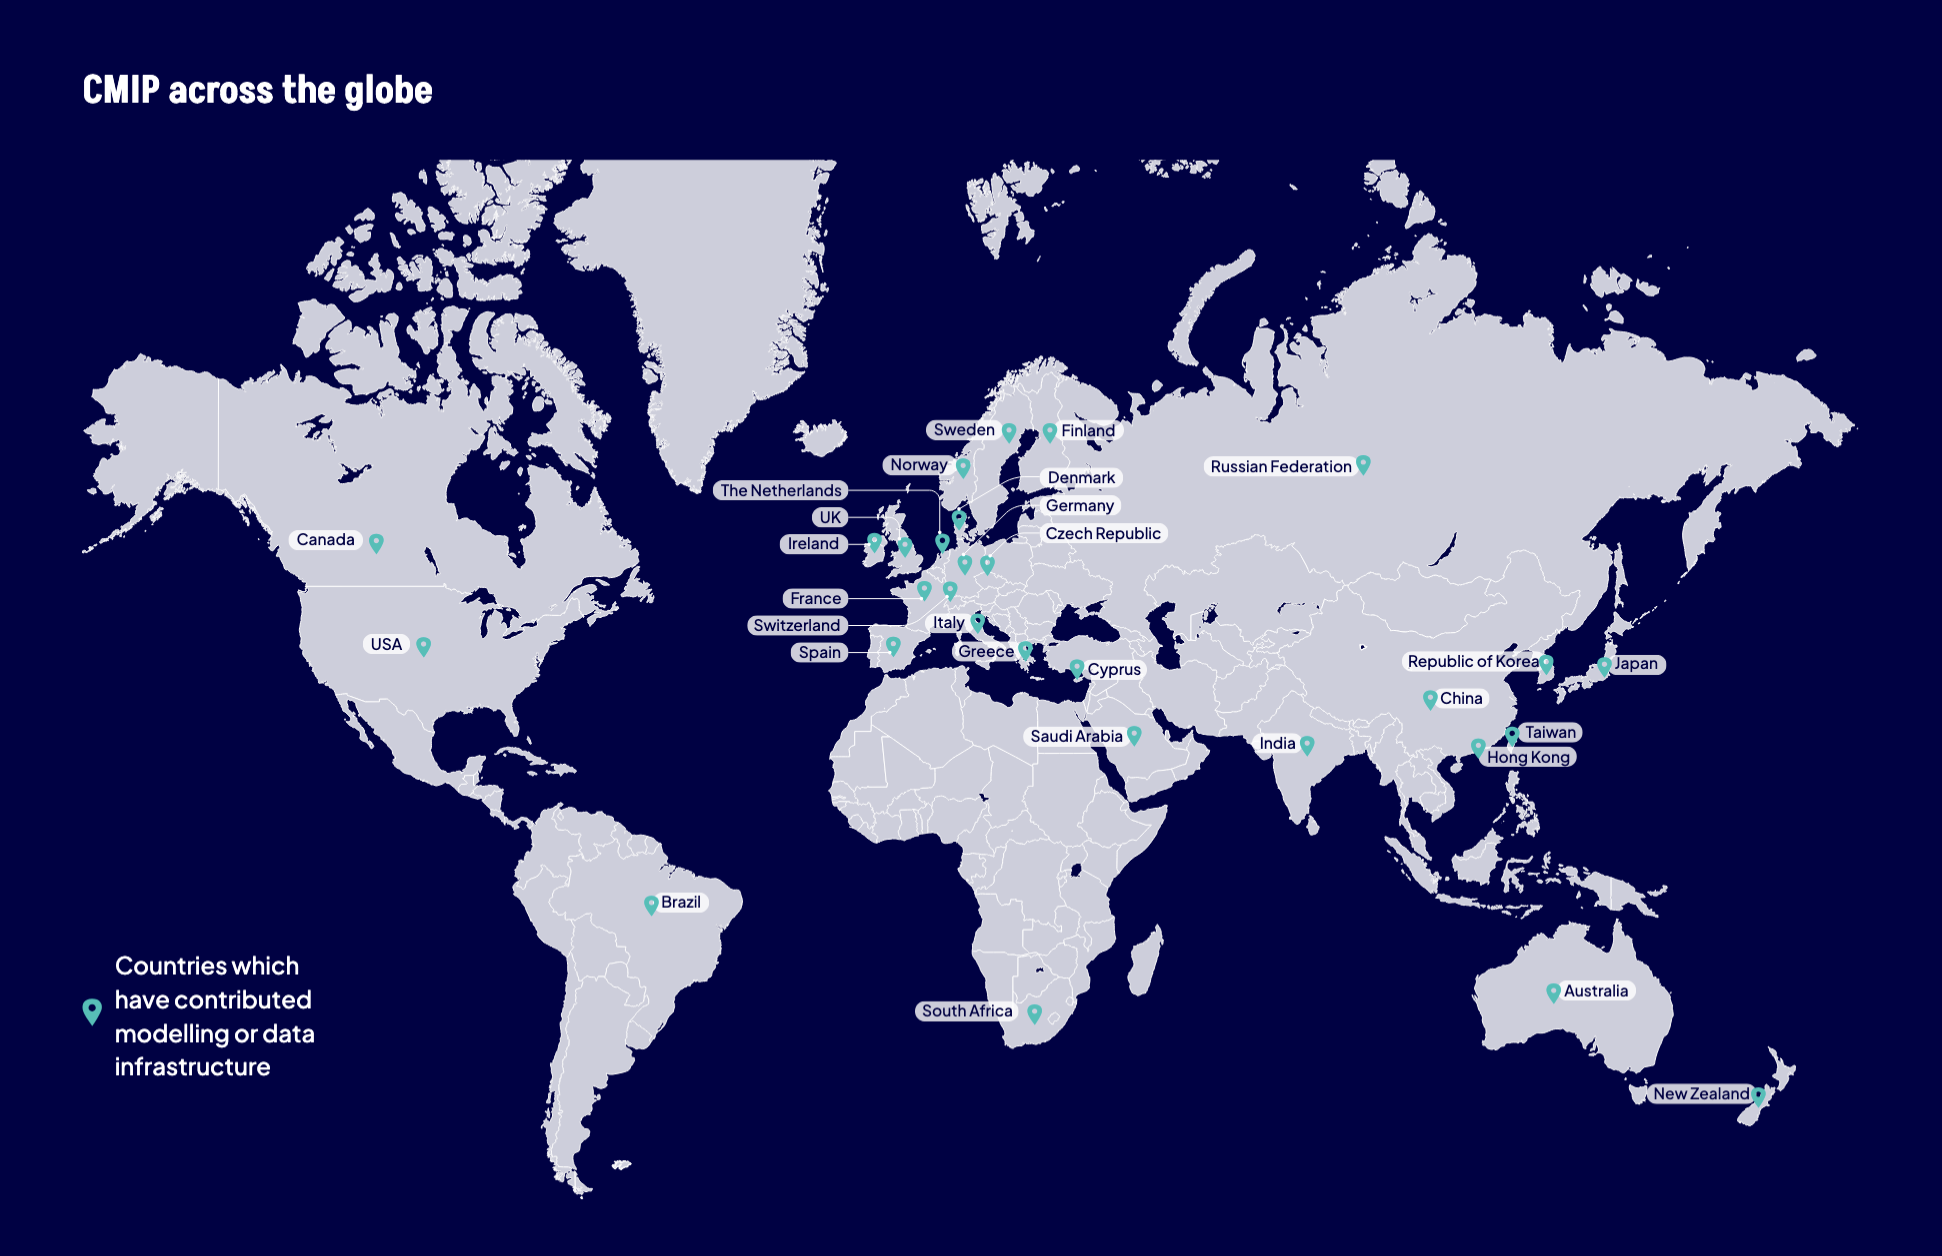
The figure below shows the countries that have either produced or published CMIP simulations.

CMIP across the globe
Countries that have contributed modelling or data infrastructure for CMIP. Credit: CMIP

During this time, scientists use new and improved models to run experiments from previous CMIP phases for consistency, as well as new experiments to investigate fresh scientific questions.

These simulations produce a trove of data, in the form of variables – such as temperature, rainfall, winds, sea ice extent and ocean currents. This information helps scientists study past, present and future climate change. 

As scientific understanding and technical capabilities improve, models are refined. As a result, each CMIP phase incorporates higher spatial resolutions, larger ensembles, improved representations of key processes and more efficient model designs.

CMIP7 objectives

Each CMIP phase has an “experimental design” that outlines which climate-model experiments should be run and their technical specifications, including the time period the models should simulate.

The CMIP7 experimental design has several components. 

As in CMIP6, for a modelling centre to contribute, they are asked to produce a suite of experiments that maintain continuity across past and future CMIP phases. 

This suite of experiments is known as the “diagnostic, evaluation and characterisation of klima” (DECK) and is used to understand how their model “behaves” under simple, standard conditions. These experiments are designed and requested directly by CMIP’s scientific governing panel. 

Alongside the DECK, CMIP also incorporates experiments developed by model intercomparison projects (MIPs) run by different research communities. For example, experiments exploring what the climate could look like under different levels of emissions or those that explore how sea ice might have changed between the last two ice-ages.

Currently, CMIP is working with 40 MIPs. These groups investigate specific scientific questions at their own pace, rather than on timelines prescribed by CMIP.

Running a large number of simulations can take modelling centres a long time. To speed up the process, CMIP7 has launched the “assessment fast track”. 

This is a small subset of CMIP7 experiments, drawn from past and present community MIPs, identified through community consultation as being critical for scientific and policy assessments.

Data from the assessment fast track will be used in the reports that will together form the seventh assessment (AR7) of the IPCC. 

It will also be used as an input by other groups that create climate information, including organisations involved in regional downscaling and modelling climate impacts and ice-sheet changes.

The figure below shows the different components of CMIP7. It shows how a subset of CMIP7 experiments will be delivered on an accelerated timeline, while the majority of experiments will be led by MIPs.

CMIP7 infographic
The different components of CMIP7. Credit: CMIP

CMIP7 experiments

There are three categories of experiments set to take place in CMIP7:

  • Historical experiments, which are designed to improve scientific understanding of past climates. Model runs exploring the recent historical period also allow scientists to evaluate the performance of models by checking how well they replicate real-world observations. 
  • Prediction and projection experiments, which allow scientists to analyse what different climates could look like under varying levels of greenhouse gas emissions, as well as near-term (10-year) prediction experiments.
  • Process understanding experiments, which are designed to better understand specific processes and isolate cause-and-effect relationships. For example, a set of experiments might change the emissions of one greenhouse gas at a time to see how much each pollutant contributes to warming or cooling the climate.

Modelling centres typically produce and publish their data for the historical and projection experiments first. 

CMIP expects the first datasets to be available by this summer, with broader publication recommended by the end of the year, in time to be assessed by IPCC AR7 authors.

Drafting of the reports of AR7 is currently underway. However, countries are yet to agree on the timeline for when they will be published. This presents a challenge for the climate-modelling community, given the difficulties of working with a moving deadline. 

(For more on the ongoing standoff between countries around the timing of publication of the reports, read Carbon Brief’s explainer.)

New emissions scenarios

Scientists use emissions scenarios to simulate the future climate according to how global energy systems and land use might change over the next century.

Crucially, these scenarios – also known as “pathways” – are not forecasts or predictions of the future. 

The group tasked with designing the scenarios for CMIP phases, as well as producing the “input files” for climate models, is the “scenario model intercomparison project”, or ScenarioMIP.

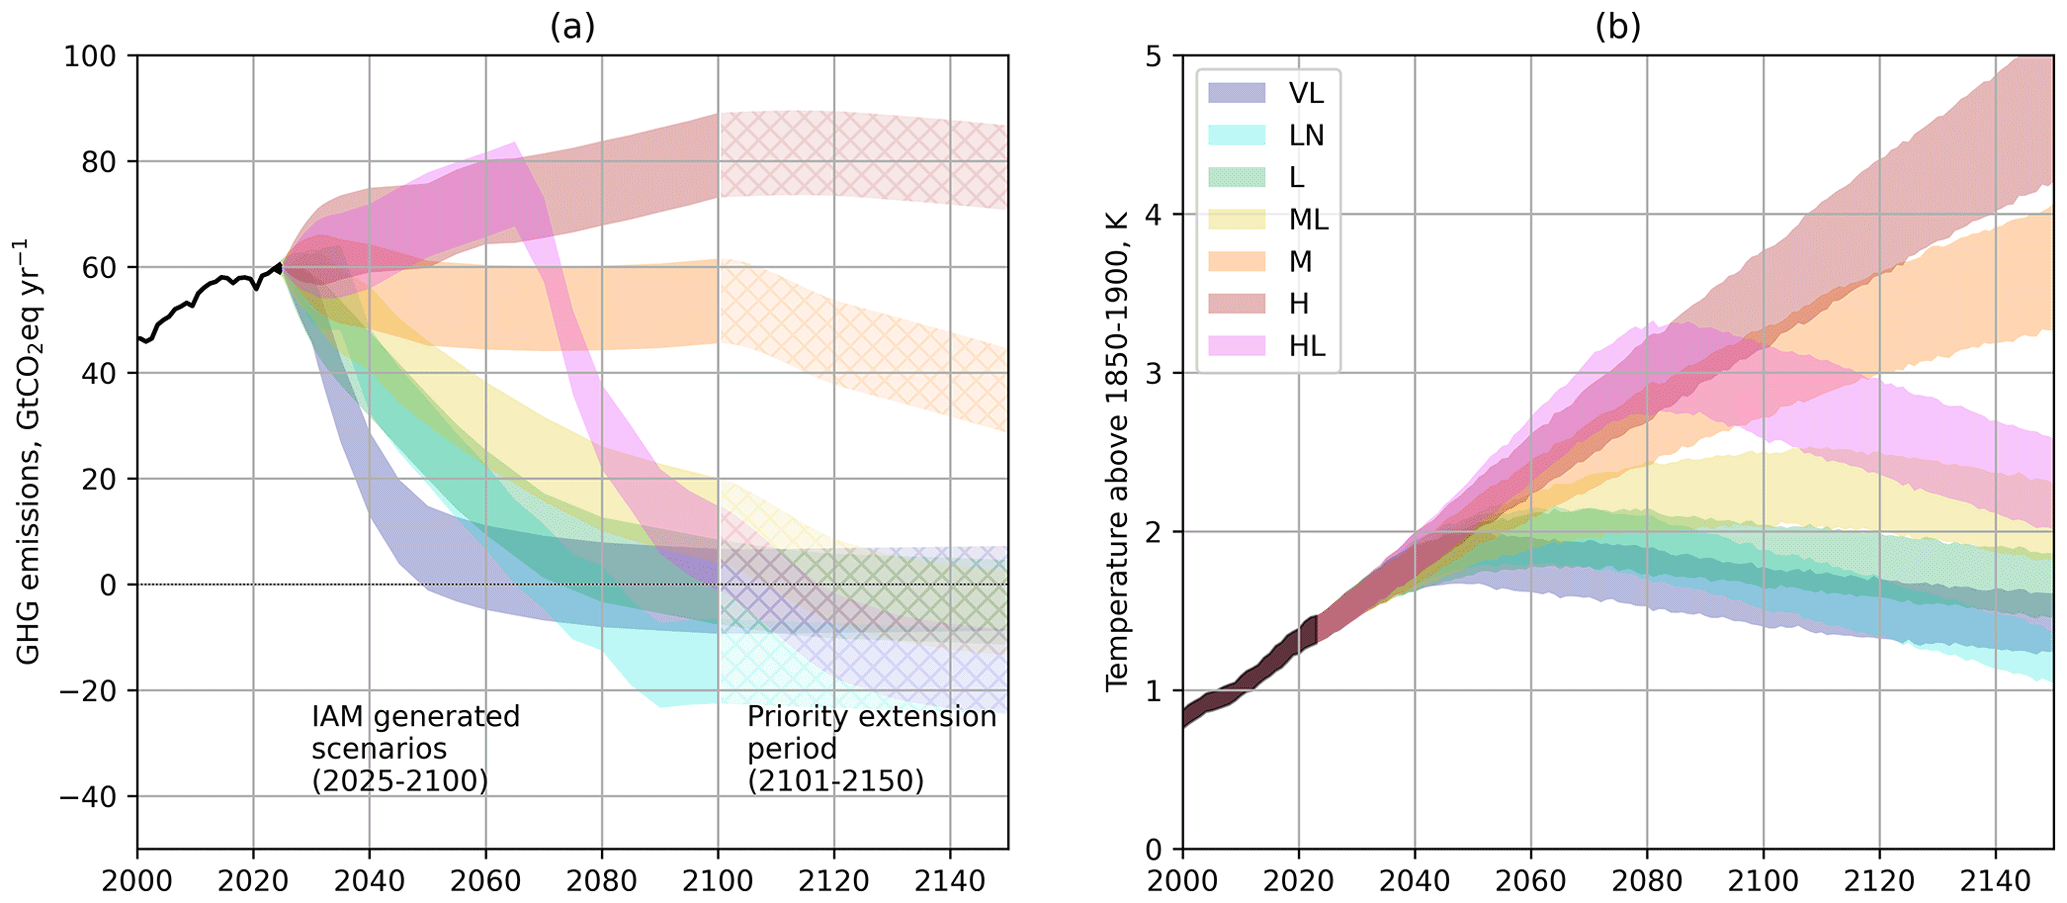
In a new paper, the group has set out the new set of scenarios for CMIP7:

  • High (H): Emissions grow to as high as deemed plausibly possible, consistent with a rollback of current climate policies. This scenario will result in strong warming. 
  • High-to-low (HL): Emissions rise as in the high scenario at first, but are cut sharply in the second half of the century to reach net-zero by 2100. 
  • Medium (M): Emissions consistent with current policies, frozen as of 2025, leading to a moderate level of warming. 
  • Medium-to-low (ML): Emissions are slowly reduced, eventually reaching net-zero emissions by the end of the century.
  • Low (L): Emissions consistent with likely keeping warming below 2C and not returning to 1.5C before the end of the century.
  • Very low (VL): Emissions are cut to keep temperatures “as low as plausible”, according to the paper. This scenario limits warming to close to 1.5C by the end of the century, with limited overshoot beforehand. 
  • Low-to-negative (LN): Emissions fall slightly slower than in the VL scenario, with temperatures just rising above 1.5C. Emissions then rapidly drop to negative to bring warming back down.

The figures below show the emissions (left) and the estimated global temperature changes (right) under the seven new scenarios for CMIP7, from the low-to-negative emissions scenario (turquoise) to a high-emissions scenario (brown). 

The greenhouse gas emissions for each of the CMIP7 climate scenarios (left) and the associated estimated average temperature change from 1850-1900 (right) using the FaIR emulator. Source: Adapted from Van Vuuren et al. (2026)

As a set, the ScenarioMIP scenarios “cover plausible outcomes ranging from a high level of climate change (in the case of policy failure) to low levels of climate change resulting from stringent policies”, the paper says.
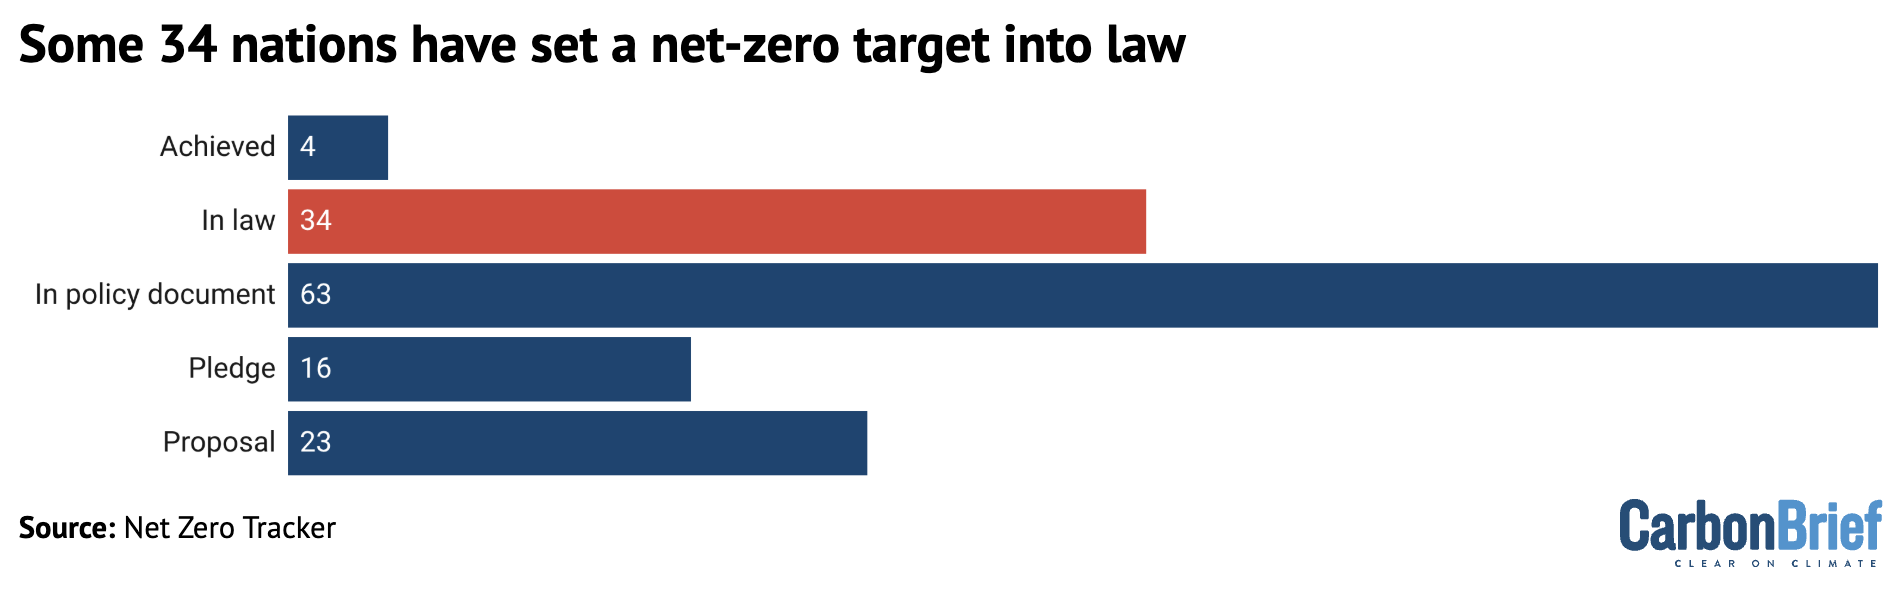
Compared to the scenarios in CMIP6, the range in future emissions they cover is now narrower, the authors say:

“On the high-end of the range, the CMIP6 high emission levels (quantified by SSP5-8.5) have become implausible, based on trends in the costs of renewables, the emergence of climate policy and recent emission trends…At the low end, many CMIP6 emission trajectories have become inconsistent with observed trends during the 2020-30 period.”

Put simply, progress on climate policies and cheaper renewable technologies means that scenarios of very high emissions have now been ruled out. 

However, this progress has not been sufficient to keep society on track for the Paris Agreement’s 1.5C goal. The paper notes that, “at this point of time, some overshoot of the 1.5C seems unavoidable”.

[The change to the high end of the scenarios has sparked misleading commentary in the media and on social media – even from US president Donald Trump. A Carbon Brief factcheck unpacks the debate.]

Also notable in the new scenarios is the “low-to-negative” pathway, which has the explicit feature of emissions becoming “net-negative”. In other words, through carbon dioxide removal (CDR) techniques, society reaches the point at which more carbon is being taken out of the atmosphere than is being added through greenhouse gas emissions. 

Reaching net-negative emissions is fundamental to “overshoot scenarios”, where global warming passes a target and then is brought back down by large-scale CDR.

Overshoot scenarios allow scientists and policymakers to investigate the impacts of a delay to emissions reductions and better understand how the world might respond to passing a warming target. This includes the question of whether some impacts of climate change, such as ice sheet melt, are reversible. 

CMIP has encouraged modelling centres to run simulations using the “high” and “very low” scenarios first to ensure downstream users of the data – including groups working on regional climate projections (CORDEX), climate impacts modelling (ISIMIP) and ice-sheet modelling (ISMIP) – have enough time to produce their data for IPCC reports.

These two scenarios were selected as they sit at opposite ends of the spectrum of climate outcomes. The high scenario will demonstrate how models behave under high emissions, while the very low scenario will demonstrate how models behave when emissions are rapidly reduced. 

CMIP has recommended that modelling centres then run the “medium” and “high-to-low” scenarios. The remaining scenarios should then follow and no official recommendation has been made yet on their production order.

Other new features 

In addition to the assessment fast track and new scenarios, CMIP7 has a number of other new developments.

Updated data for simulations

Climate models use input datasets to define the set of external drivers – or “forcings” – that have caused the global warming observed so far. These drivers include greenhouse gases, changes to incoming solar radiation and volcanic eruptions.

CMIP recommends modelling groups use the same input datasets, as this makes it easier to compare model results.

In CMIP7, the historical forcing datasets available for modelling groups to use have been improved to better represent real-world changes and extended closer to the present day. The historical simulations will be able to simulate the past climate from 1850 through to the end of 2021, whereas CMIP6 only simulated the past climate through to 2014. 

CMIP is also planning to extend these historical datasets through to 2025 and maybe further throughout the course of CMIP7. 

Emissions-driven simulations 

CMIP7 introduces a new focus on CO2 emissions-driven simulations, providing a more realistic representation of how the climate responds to changes in emissions.

In older generations of climate models, atmospheric levels of CO2 and other greenhouse gas concentrations have been needed as an input to the model. These levels would be produced by running scenarios of CO2 emissions through separate carbon cycle models. The resulting climate-model runs were known as “concentration-driven simulations”. 

However, many of the latest generation of models are now able to run in “emissions-driven mode”. This means that they receive CO2  emissions as an input and the model itself simulates the carbon cycle and the resulting levels of CO2 in the atmosphere. 

This development is important, as climate policies are typically defined in terms of emissions, rather than overall atmospheric concentrations. 

This new development in modelling will enable a more realistic representation of the carbon cycle and a better understanding of how it might change under different levels of warming. 

Enhanced model documentation and evaluation

All CMIP7 models will be required to supply standardised model documentation that ensures consistency across model descriptions and makes it easier for end users to understand the data. 

Additionally, CMIP scientists have developed a new open-access tool that dramatically speeds up the evaluation of climate models. 

This “rapid evaluation framework” allows researchers to compare model outputs with real-world observations, providing immediate insight into model performance. 

Categories
Energy

Experts: Why migration is ‘not a failure of adaptation’ in a warming world

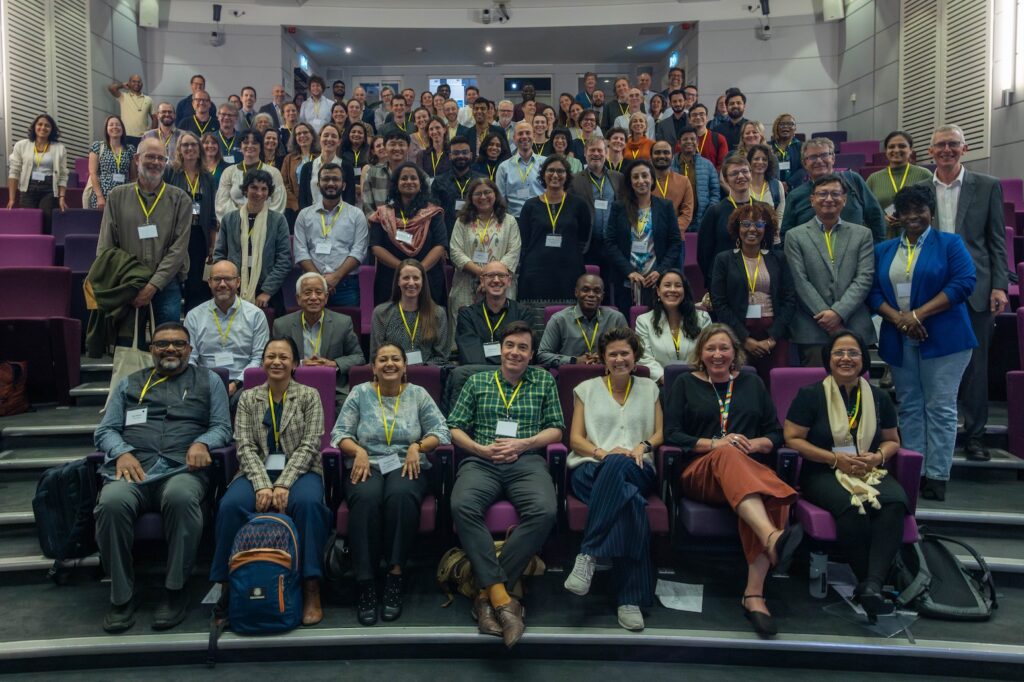
Hundreds of scientists gathered in London this week to discuss the role of migration as a way for communities to adapt to climate change.

The impacts of a warming world, such as sea level rise and worsening extremes, are pushing many people around the world to leave their homes.

As a form of climate adaptation, a decision to migrate involves an array of different factors, such as politics, conflict and economic opportunity.

The conference unpacked these topics, as well as the impacts of climate change on livelihoods, relocation and gender norms across Africa and Asia.

The event had a strong focus on urban areas, with one co-convenor stating that “half of the world’s population now lives in the cities…A lot of the battles of climate adaptation will be won and lost in cities.”

Another co-convenor told Carbon Brief that the conference’s “focus really is on the climate change adaptation community, showing that migration is not a failure of adaptation – it is part of adaptation”. 

Carbon Brief attended the conference to report on the sessions and speak to world-leading experts on climate-driven migration.

Migration as adaptation

The two-day conference on “mobility in adaptation to climate change” was held at Wellcome’s headquarters in London. It gathered more than 100 leading experts in migration, adaptation and climate change from countries across Europe, Africa and Asia.

On day one of the conference, co-convenor Prof Neil Adger, a professor from the University of Exeter, told Carbon Brief:

“Our focus really is on the climate change adaptation community, showing that migration is not a failure of adaptation – it is part of adaptation.”

In his opening address, Adger highlighted that there were still many unknowns on climate migration – such as how and when it is an appropriate way to adapt to climate change, and who benefits and loses in these situations.

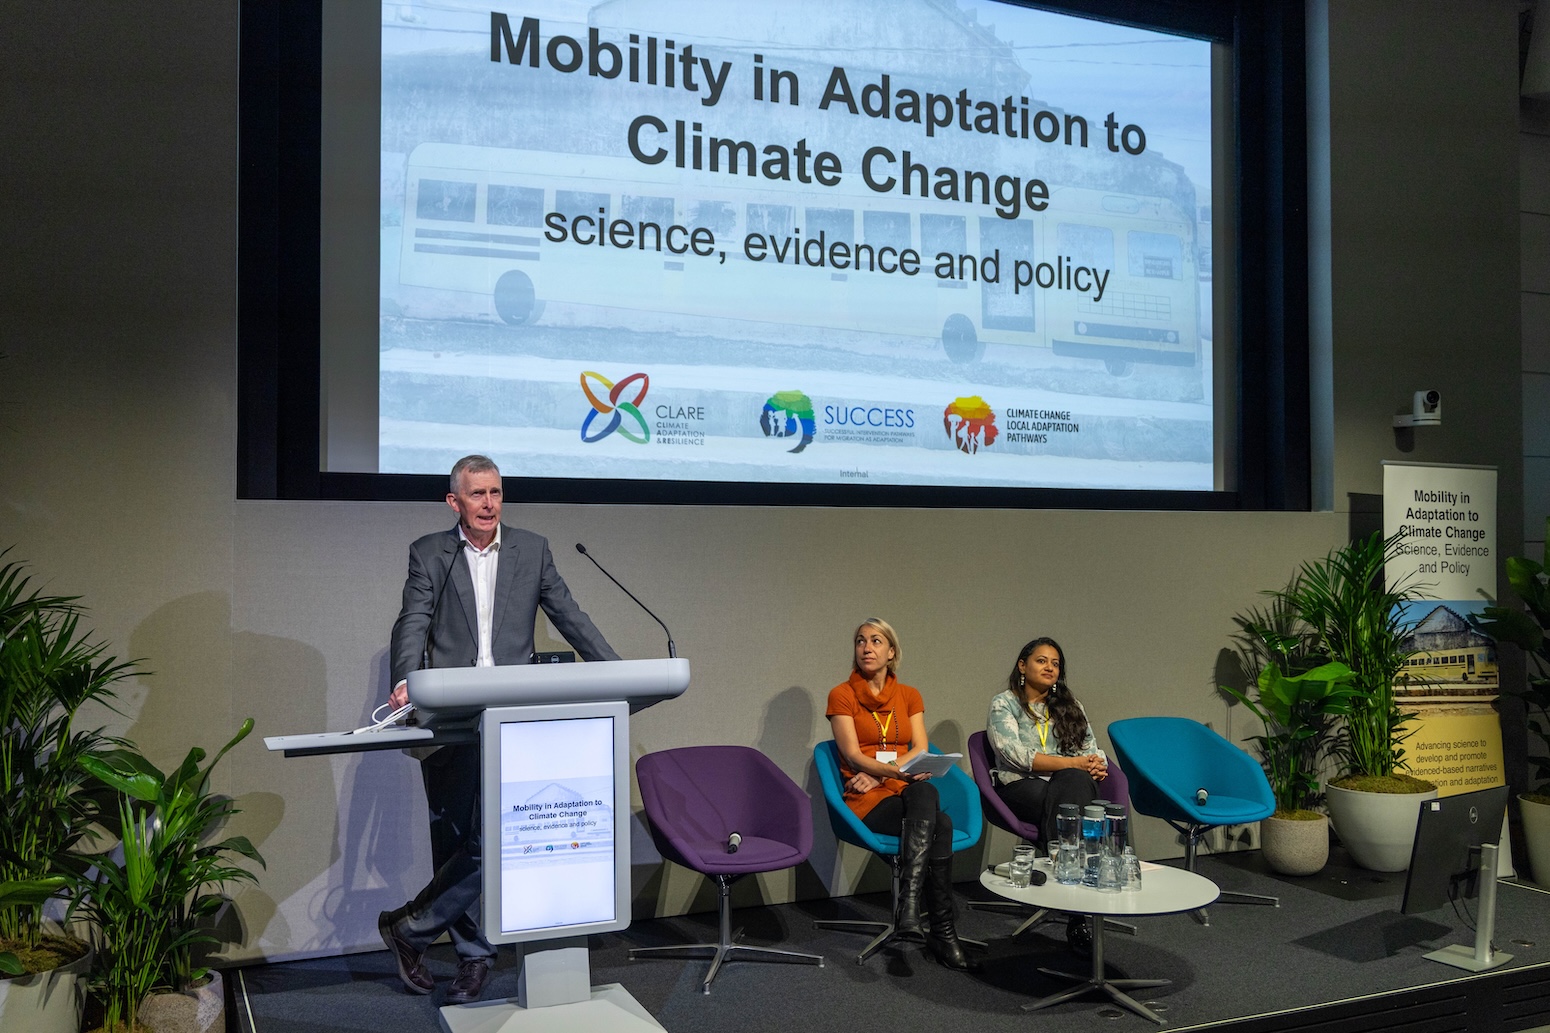
Prof Neil Adger from the University of Exeter, opening the conference.
Prof Neil Adger from the University of Exeter, opening the conference. Credit: Hemant Kumar from the IIHS Media Lab.

Dr Manuela Di Mauro – the head of climate-adaptation research at the UK Foreign Commonwealth and Development Office – took to the stage next. She told attendees that mobility has always been a part of human life, stating:

“We are all migrants. We are all part of the same history.”

She urged the scientific community to “learn the language and the political perspective” needed to support and engage with policymakers about climate-driven migration.

Conference co-convenor Dr Chandni Singh from the Indian Institute for Human Settlements (IIHS) then delivered the first in-depth talk of the conference, outlining the current state of knowledge on climate change and migration.

She explained that cross-border migration is “emotionally and economically arduous” adding “under a changing climate, people choose to move within national borders first”. (Estimates suggest that around three-quarters of total global migration is internal.)

Singh emphasised that “mobility choices are extremely complex and nuanced, based on one’s aspirations and capabilities, social norms and asset bases”. She continued:

“Some [people] are forced to move or are displaced, others are relocated preemptively to move people out of harm’s way and others choose to stay despite escalating risk – or because resilience-building measures allow people to stay.”

She stressed that people need resources to migrate, so the poorest people are often unable to move – leaving them in a state of “immobility”. However, she also noted that most people do not want to leave their homes, stressing the “visceral reality of place attachment”.

Singh explained that many families “live dual lives”, in which family members work in the city to save money for a life back in their village. This dynamic of living across two locations is often referred to as “translocality”.

For example, Singh shared the story of residents from the Indian village of Kolar, who travel more than 100km to and from Bangalore for work every day, or else live there in informal settlements.

These workers send the money they earn back home, where it is often used to dig bore wells to access water. However, Singh warned that climate change and poor water management mean these wells often fail year after year, trapping people in this cycle of travelling to Bangalore to earn more money.

Singh also stressed the prevalence of rural-to-urban migration. She cited UN estimates (that do not explicitly include climate-driven migration), which find that around 2.5 billion people are expected to migrate from rural to urban areas by 2050. It adds that 90% of the change occurring in Africa and Asia.

Singh added:

“Half of the world’s population now lives in the cities…A lot of the battles of climate adaptation will be won and lost in cities.”

She noted that although migration “helps to manage risks”, it also has “significant financial, personal and social costs”. 

Singh went on to discuss the global goal on adaptation – a set of 59 indicators to measure global progress on adaptation. Singh said that “migration and mobility are completely invisible…and therefore completely overlooked” in the goals. 

She concluded by discussing the importance of new narratives on climate change and migration, saying:

“It’s the narratives and stories we tell of this moment that can help us first acknowledge what is happening, help subvert misinformation and untruths, and really demand accountability.”

Back to top

Cities and livelihoods

Migration from villages to cities was a central theme of the conference. 

On day two of the conference, Dr Aromar Revi, founding director of the IIHS, told delegates that the “root cause of the climate emergency is maldevelopment” and emphasised the importance of pursuing adaptation, mitigation and development goals together.

Dr Aromar Revi, founding director of the IIHS, addressing conference attendees
Dr Aromar Revi, founding director of the IIHS, addressing conference attendees. Credit: Hemant Kumar from the IIHS Media Lab.

He noted that the Intergovernmental Panel on Climate Change is currently working on a special report on climate change and cities and argued that “cities will play a decisive role in shaping global climate futures”.

He continued:

“Cities concentrate opportunities, but they also concentrate poverty, inequality and risk. And that’s something that we really don’t know how to understand, especially in a changing climate.”

Throughout the conference, many of the delegates presented nuanced stories of rural-to-urban migration from individual communities. These case studies highlighted the complex, interlinking factors that drive a person’s decision to move and the wide range of outcomes.

Dr Aysha Jennath from the IIHS presented the results from her research, which unpacks the experiences of migrants who have moved from rural to urban areas, for a range of reasons including the changing climate and for better livelihoods.

Jennath and her colleagues interviewed thousands of migrants living in informal settlements, or working in informal jobs, in large cities in Bangladesh, Bhutan, India and Nepal. The researchers’ questions aimed to understand the migrants’ “wellbeing, adaptive capacity and precarity”.

Overall, Jennath found that migrants in large cities are vulnerable to poor housing, unsafe working conditions and a lack of basic social services. 

Dr Binaya Pasakhala and Dr Sabarnee Tuladhar from the International Centre for Integrated Mountain Development, presented initial results from the Climate Adaptation and Resilience (CLARE) project, in which researchers interviewed households across Bangladesh, Bhutan, India and Nepal about migration patterns.

They conducted hundreds of surveys to identify how households are adapting to the changing climate and grouped responses into a series of “pathways” describing the impacts of rural-to-urban migration on their livelihoods. 

Dr Binaya Pasakhala and Dr Sabarnee Tuladhar from the International Centre for Integrated Mountain Development and Halvard Buhaug Peace Research Institute Oslo answering questions in a panel discussion.
Dr Binaya Pasakhala and Dr Sabarnee Tuladhar from the International Centre for Integrated Mountain Development and Halvard Buhaug Peace Research Institute Oslo answering questions in a panel discussion. Credit: Hemant Kumar from the IIHS Media Lab.

For example, Tuladhar noted that in Bhutan, there is a huge emphasis on education, which has “changed the aspirations of the community – especially the youth”. This drives “huge depopulation” from rural areas as young, educated people migrate to urban areas or internationally, she said. 

This mass movement into the cities provides opportunities for young people. It also provides money for the families back home – a type of finance known as remittances.

However, it also “weakened resilience” in the villages through “gungtong” – a phrase which translates literally to “empty houses”.

However, they also described the case of Nepal’s Baragon mountain community, where remittances from people who moved to urban centres has allowed communities in the villages to shift livelihoods away from subsidence farming towards commercialised farming and tourism. In this case, “migration has actually strengthened the resilience of the community”, Tuladhar said.

Prof Nitya Rao is a researcher in gender and development at the University of East Anglia (UEA), also presented research funded by CLARE.

She told the conference that when men are forced to leave for work, due to a lack of other options, a lot of their earnings go towards “survival” and less is saved. On the other hand, “mixed migration” – such as the movement of a father and son  – is often “aspirational”. It typically yields higher remittances and improves adaptive capacity back home, according to Rao.

Speaking to Carbon Brief, Rao argued that in order to “make migration a case of adaptation and not just survival in the short term”, destination cities need to do more to welcome migrants.

Prof Nitya Rao addressing conference attendees.
Prof Nitya Rao addressing conference attendees. Credit: Hemant Kumar from the IIHS Media Lab.

Dr Maria Franco Gavonel, a lecturer at the University of York and Prof Mumuni Abu, a senior lecturer from the University of Ghana, explored the concept of “social tipping points” in migration decision-making. 

They suggested that as a drought intensifies, there may be a threshold at which households decide to leave. The authors compared drought indices to immigration patterns across communities in Ghana, Mali, Kenya and Ethiopia, but did not find evidence of a social tipping point.

This could be because households anticipate severe droughts and leave before they hit, the speakers suggested. They also noted that there are many government-led policy responses to drought that could affect a household’s decision to stay or leave. 

For example, Kenya has a livestock-insurance policy to help families who lose animals during drought. Similarly the African Union uses satellite data to assess the severity of droughts and provide compensation to affected households.

In the final session of the conference, Dr Kasia Paprocki, an associate professor of environment at the London School of Economics and Political Science, provided a counterpoint to the idea that the vast majority of villagers want to abandon farming and move to the city.

She argued that people are often displaced from rural communities and unable to live farming lifestyles, even if they want to, adding:

“I have found that agrarian dispossession is being intensified through development interventions that are today being referred to as climate change adaptation.”

She argued for the need to “reorganise economies” to enable people to stay “if they would like to”, adding:

“Climate change adaptation and climate migration without meaningful agrarian reform will not produce climate justice.”

Back to top

Immobility and relocation

Movement from rural to urban areas was not the only migration pattern discussed in the conference. Experts also discussed movement patterns including planned relocation and immobility. 

The graphic below – adapted from the 2021 Groundswell report and originally published in Carbon Brief’s 2024 explainer on climate-driven migration – shows different categories of mobility and immobility due to climate change.

Different categories of human mobility and immobility due to climate change
Different categories of human mobility and immobility due to climate change. Source: Adapted from the Groundswell report (2021).

Dr Roman Hoffmann from the International Institute for Applied Systems Analysis’s migration and sustainable development research group opened a session on “immobility” by presenting a way of defining and measuring the phenomenon.

He told Carbon Brief that immobility is “basically the absence of movement”, adding:

“The are different types of immobility. We have voluntary and involuntary immobility – and sometimes these different forms are not so clearly distinguishable, but there’s more sort of a continuum. Basically, the question is whether people are able to realise their aspirations to move or to stay.”

In his talk, Hoffman noted that media narratives around migration often focus on large movements of people, while the topic of immobility “falls between the cracks”.

Immobility is often seen as a problem experienced by the poorest and most vulnerable members of society – for example, because people cannot find or afford the resources they need, such as food or transportation, because they are not healthy enough to move or because they do not have the social network they require to make such a big change.

However, Dr Joyce Soo from the Lund University Centre for Sustainability Studies, explained that there are also instances when “wealth enables immobility”. 

Soo explained that in coastal regions of Sweden that are exposed to extreme events, many residents there choose to stay, as there is “strong trust in government protection”, such as coastal defences. She explained that in this instance “immobility is linked to identity and status”.

A separate session at the conference focused on planned relocation – the organised movement of a group of people away from a site that is highly vulnerable to climate extremes. 

Dr Ricardo Safra de Campos, a senior lecturer in human geography at the University of Exeter, told the delegates that planned relocation is “arguably the most controversial aspect of mobility as a response to climate change” and is usually implemented when “all other forms of in-situ adaptation have failed”.

Safra de Campos and Nihal Ranjit, a senior research associate at IIHS, worked with a team of researchers to interview people who underwent planned relocation programmes in India and Bangladesh. 

They told delegates that planned relocation is often implemented when people feel unsafe – for example due to climate extremes – resulting in an “erosion of habitability”.

However, Ranjit explained “safety alone doesn’t make relocation successful”. He argued that the most important aspect of planned relocation is to ensure that migrants do not lose their livelihoods.

He presented the example of Ramayapatnam – a fishing village in India where houses were slowly being lost to coastal erosion. Ranjit explained that a planned relocation programme was set up to move people away from the coast, but that many people refused to move, as doing so would mean losing their only means of earning money. 

He also noted the many Indian citizens hold a deep mistrust of the government and question the authorities’ intentions.

Relocation must be “rights-based, participatory, livelihood-centred and attentive to culture, community and long-term wellbeing”, Ranjit said.

Meanwhile, Dr Annah Pigott-McKellar, a human geographer at the Queensland University of Technology, compared two case studies of relocation in Australia. 

When devastating flash floods hit Queensland in January 2011, a relocation programme led by the local government was set up to move people. The first houses were built within a year, and people were moved in “extremely fast”, Pigott-McKellar said. She explained that the goal was to keep the town together and “keep some level of social continuity”.

Conference attendees asking questions to the panel.
Conference attendees asking questions to the panel. Credit: Hemant Kumar from the IIHS Media Lab.

Conversely, when northern New South Wales faced severe flooding in 2022, the response was slow, according to Pigott-McKellar. She explained that different members of the community were offered varying levels of assistance by the state. For example, some households offered buybacks for their lost properties, while others were not. 

The result was a “fragmented and dispersed mobility pathway” that saw the community split up and mistrust in the government grow. 

Pigott-McKellar emphasised the importance of follow-through and continuity in relocation, stating:

“Relocation isn’t a moment in time. It is a process that unfolds over months or years”.

Back to top

Legal pathways

Most human migration happens within borders. However, conference delegates also discussed cases in which people move to other countries, with a focus on the possible legal pathways.

Prof Jon Barnett, professor in the school of geography, Earth and atmospheric sciences at the University of Melbourne, explained migration patterns in the south Pacific islands.

He told delegates that climate change is causing “significant social impacts” across the islands, adding:

“While we can’t say that climate change is a major factor in migration decisions…there is a “fingerprint of climate change in [all] migration decisions.”

Barnett outlined legal migration routes for Pacific islanders, such as Fiji’s climate relocation trust fund, which has already had more than 2,000 requests, or seasonal worker schemes to New Zealand, which have already issued 137,000 visas.

However, he noted that there is a “massive burden” for the women who stay on the Pacific islands when their husbands leave. He explained that not only do women substitute for the labour of the men, but climate change can also amplify their workload by making farming more difficult and illnesses more widespread. 

He concluded:

“Migration cannot be the only adaptation strategy we offer to the Pacific Islands. It’s got to be one strategy in the portfolio.”

Speaking separately to Carbon Brief, he said:

“As climate change amplifies pressures on people’s livelihoods, we may end up with a whole series of transnational populations that are kind of constantly in churn – where they’re not just living on the island, but also in Australia, New Zealand, the US. 

“That’s not necessarily a bad thing, I think, so long as people still have a right to return to their islands and can do so – and are making informed choices…to manage their climate risk.”

Demographer Prof Raya Muttarak, from the University of Bologna, told delegates that Italy is the only EU country with explicit legislation for climate-related protection. 

This six-month residence permit was introduced in 2018, for people who are found to have faced a “contingent and exceptional calamity”. However, she noted that there are flaws in the evidence base for making these claims, which can make it difficult for people to obtain the permits.

Back to top

Changing narratives 

Many speakers discussed the framing of climate change and migration in their talks. There was also a workshop on how to develop and promote “new narratives” around migration as an adaptation response to a changing climate on the first day of the conference.

Workshop on “new narratives”.
Workshop on “new narratives”. Credit: Hemant Kumar from the IIHS Media Lab.

Dr Reetika Subramanian, a senior research associate at UEA who helped to organise the conference, told Carbon Brief that many media narratives around migration are “alarmist” and “crisis-based”, with a focus on people from poorer countries illegally entering wealthier countries.

However, explained that the conference convenors wanted to begin work on developing a new framing for migration – both in response to climate change and more generally – focusing on its “adaptive aspects”.

Dr Benoy Peter, the executive director of the Centre for Migration and Inclusive Development, told Carbon Brief that “far right” media and politics often “leverage” migration to present a negative framing.

However, he said that he sees migration as a “solution”, describing it as the “fastest way for intergenerational upward social mobility for people from socially and economically disadvantaged populations”. 

Prof Kerilyn Schewel, assistant professor of sociology at the University of North Carolina at Chapel Hill, told Carbon Brief that the migration community has “moved beyond a ‘push factor’ narrative – that climate change is coming and uprooting communities – to a more nuanced perspective that recognises that people are already moving for all kinds of reasons”.

She said the new “research frontier” is “seeing how environmental factors intersect with these other social or developmental outcomes”, such as education.

Liby Johnson, the executive director of development organisation Gram Vikas, told the conference his reason for hope:

Attendees of the “mobility in adaptation to climate change” conference.
Attendees of the “mobility in adaptation to climate change” conference. Credit: Hemant Kumar from the IIHS Media Lab.

“Communities are figuring this out. They are not rejecting mobility – they are asking for mobility that is safer, fairer and more dignified. Communities affected by climate uncertainty are not simply enduring crises – they are actively using mobility to diversify risk, protect dignity and build better futures.”

Revi, from the IIHS, told Carbon Brief:

“The future of mobility is much more certain than the climate futures are. People have been mobile for a very long time. That’s been an important part of the transformation of societies and economies for centuries…Mobility is part of the solution. It is not the full solution, but it’s part of the solution. People are voting with their feet and with their aspirations to make a change.”

Back to top

Categories
Energy

DeBriefed 22 May 2026: UN adopts landmark resolution | Trump takes on ‘RCP8.5’ | Climate migration

Welcome to Carbon Brief’s DeBriefed. 
An essential guide to the week’s key developments relating to climate change.

UN adopts landmark opinion

ICJ OPINION: The UN has adopted a resolution backing a landmark world court opinion stating that countries have a legal obligation to address climate change, reported the Guardian. Some 141 countries voted in favour of the resolution, while only eight voted against: the US; Israel; Iran; Russia; Belarus; Saudi Arabia; Yemen; and Liberia. There were also 28 absentations, including India and Turkey, the host of COP31.

‘DETERMINED’: The text adopted by the UN general assembly “stresses” that “climate change is an unprecedented challenge of civilizational proportions” and says the assembly is “determined” to “translate the court’s findings into enhanced multilateral cooperation and accelerated climate action at all levels, consistent with international law”. The text “urges” states to implement measures including “transitioning away from fossil fuels in energy systems”. It also “requests” the next UN secretary general to report on progress in 2027 and adds a formal follow-up to the agenda of the UN general assembly in 2028.

AMENDMENTS REJECTED: A UN press summary detailed how countries rejected four proposed amendments to the text by a group of largely Arab nations. These amendments would have undercut the world court’s legal advice on countries’ climate obligations by saying its views should only be taken into account “as appropriate”. They also would have added a reference to 2C, instead of focusing on 1.5C alone, got rid of the formal follow-up process in 2028 and added a reference to the role of carbon capture and storage.

Scenario sceptic

‘GOOD RIDDANCE’: US president Donald Trump declared “good riddance” to a very high emissions modelling scenario in a Truth Social post on Saturday, misleadingly stating that “the United Nations TOP Climate Committee just admitted that its own projections (RCP8.5) were WRONG! WRONG! WRONG!” The post was quickly picked up by right-leaning media, including Fox News, the New York Post and the Australian.

NEW SCENARIOS: Trump’s claim follows the publication of a new set of emissions scenarios that will underpin research cited in the next set of reports from the Intergovernmental Panel on Climate Change (IPCC). In a guest post for Carbon Brief, scientists explained that the very high emissions scenario has “become implausible, based on trends in the costs of renewables, the emergence of climate policy and recent emission trends”. 
TRUMP FACTCHECKED:Carbon Brief published a factcheck of Trump’s claims. It noted that the IPCC does not develop, control or own climate scenarios and has not published anything stating that any climate scenario is “wrong”. It added: “Projections suggest that the world is still on course for between 2.5C and 3C of warming…previously described as ‘catastrophic’ by the UN.”

  • ADAPTATION NEEDED: The UK’s Climate Change Committee outlined how investing in adaptation now could produce “long-term savings”, Carbon Brief reported. UK ministers are preparing to accept a CCC recommendation to “set a legally binding goal of cutting emissions 87% by 2040”, reported the Times.
  • ELECTRIFY EVERYTHING: COP31 president-designate Murat Kurum told the Copenhagen climate ministerial that countries should be “decarbonising the way we generate electricity, but also expanding electrification into every sphere of life”, according to Climate Home News.
  • STAFF CUT: Australia’s national science agency, CSIRO, is preparing to fire one-third of the team working on the national climate model that provides future projections, reported the Guardian. 
  • TARGET MISSED: An independent body has warned that Germany is expected to miss its 2030 climate goals and emit more CO2 than previously forecast, reported Reuters. According to Deutsche Welle, the country could breach its goal by up to 100m tonnes of CO2.
  • PEAK POWER: India’s peak power demand “smashed all records” on Tuesday, after the country’s ongoing heatwave drove a “sharp rise” in electricity consumption, according to the Economic Times. The record fell again on Thursday, said Reuters.

140

The number of countries in the world that have net-zero targets.

2

Major emitters that do not have a net-zero target – a group comprising Iran and the US, according to Carbon Brief analysis.


  • Global warming above 4C is projected to cause large decreases in “climate connectivity” between habitats for land animals | Nature Climate Change
  • Around 6% of respiratory deaths in Brazil from 2010-20 were attributable to “non-optimal temperatures”, accounting for more than 66,000 excess deaths | PLOS Climate
  • Fungi that cause diseases in plants will approximately double in abundance around the Antarctic Peninsula by 2100 under a moderate emissions scenario | Global Change Biology

(For more, see Carbon Brief’s in-depth daily summaries of the top climate news stories on Monday, Tuesday, Wednesday, Thursday and Friday.)

Four charts showing that new coal plants hit '10-year high' in 2025

The world added nearly 100 gigawatts (GW) of new coal-power capacity in 2025 – the equivalent of roughly 100 large coal plants – according to the latest annual report from Global Energy Monitor (GEM). This is a ten-year high, according to Carbon Brief’s coverage, which noted that the world’s coal plants nevertheless generated less electricity. The chart above shows that 95% of the new coal plants were built in India and China last year.

Climate migration

This week, Carbon Brief speaks to experts at a conference on migration and climate change in London about what their research could mean for how people move around the world in the future.

Prof Kerilyn Schewel, assistant professor of sociology at the University of North Carolina at Chapel Hill

We have moved beyond a ‘push factor’ narrative – that climate change is coming and uprooting communities – to a more nuanced perspective that recognises that people are already moving for all kinds of reasons… [For example] the more that young people are accessing formal education, the more they want to leave – particularly rural communities. We have to be very careful not to assume that when people want to leave, it is always driven by climate change. There are other developmental factors that are also shaping desires to move. This is a research frontier – seeing how environmental factors intersect with these other social or developmental outcomes.

Dr Aromar Revi, founding director of the Indian Institute for Human Settlements

The future of mobility is much more certain than [climate change is]. People have been mobile for a very long time. That’s been an important part of the transformation of societies and economies for centuries…mobility is part of the solution [to climate change]. It is not the full solution, but it’s part of the solution. People are voting with their feet and with their aspirations to make a change.

Prof Nitya Rao, a professor of gender and development at the University of East Anglia

There are many things that the system can do to welcome migrants and be more sensitive to different types of migrants and their needs… In the short term, [migrants] need piped water, a proper home, care for young children…In the longer term, we have to address structural inequality. There are still barriers to people accessing resources – especially productive assets such as land, capital and livestock…And these barriers are split by gender, class, ethnicity and so on. These need to be addressed, I think, to really make migration a case of [climate] adaptation and not just survival.

Prof Jon Barnett, professor in the school of geography, earth and atmospheric sciences at the University of Melbourne

In the Pacific islands, international migration isn’t driven by climate change. It’s enabled by the capacity of people to cross borders, so it’s all about migration agreements. As climate change amplifies pressures on people’s livelihoods, we may end up with a whole series of transnational populations that are kind of constantly in churn – where they’re not just living on the island, but also in Australia, New Zealand, the US.

Dr Maria Franco Gavonel, lecturer in global social policy and international development at the University of York

The migration response towards almost any climate event is short lived and short distance, so it will mostly affect internal movement rather than international…So all these narratives about climate refugees – like human rights related to international migration – are overstating the extent to which this is going to happen.

Dr Benoy Peter, the executive director of the Centre for Migration and Inclusive Development in India

Every one of us, including you and me, have benefited from migration. Migration is the fastest way for intergenerational upward social mobility for people from socially and economically disadvantaged populations. So I see migration as a [climate] solution.

Cecilia Keating also contributed to this spotlight. Read more of Carbon Brief’s coverage of the conference.

Watch, read, listen

TICE QUESTIONED: The Bloomberg Zero podcast interviewed Richard Tice, the deputy leader of the hard-right Reform UK party, who exposed his rejection of climate science and support for the oil and gas industry.

‘CLIMATE CROSSROADS’: The Guardian examined how Colombia’s upcoming election could leave the major oil-and-gas producer at a “climate crossroads”.

LAND GRAB: A Floodlight investigation for Inside Climate News examined “Trump officials, billionaires and the quiet reshaping of America’s public lands”.

Coming up

Pick of the jobs

  • Bulletin of the Atomic Scientists, editor in chief | Salary: $140,000-$160,000. Location: Washington DC, Chicago or New York City
  • Climate Outreach, researcher | Salary: £44,000. Location: Remote (UK)
  • University of Manchester, research associate, energy and climate governance | Salary: £37,694-£46,049. Location: Manchester, UK

DeBriefed is edited by Daisy Dunne. Please send any tips or feedback to [email protected].

This is an online version of Carbon Brief’s weekly DeBriefed email newsletter. Subscribe for free here.

Categories
Energy

DeBriefed 15 May 2026: Trump-Xi talk energy | ‘Supercharged’ El Niño | India’s first ‘heat lounges’

Welcome to Carbon Brief’s DeBriefed. 
An essential guide to the week’s key developments relating to climate change.

US-China meet

ENERGY TALKS: Trump administration officials have raised the prospect of China buying more US oil in response to the disruption caused by the Iran war, following two days of talks between the leaders of the superpowers in Beijing, said Reuters. On Thursday, US treasury secretary Scott Bessent told CNBC the nations had discussed China “buying more US energy”, adding that production from Alaska would be a “natural” ⁠for China. The Hong Kong-based South China Morning Post reported that Trump and Xi also agreed that the strait of Hormuz must remain open to “support the free flow of energy”. 

CLIMATE ‘COOPERATION’: Ahead of the talks, the Communist party-affiliated People’s Daily published an article saying that addressing climate change requires “coordinated efforts and cooperation” between China and the US. State-run newspaper China Daily said that US-China cooperation on energy security and climate governance is “essential” because the two countries have “considerable influence over international institutions”. However, an article in Legal Planet said that the Trump-Xi meeting had no climate agenda, adding that the two countries are now moving in “radically different directions”.

El Niño extremes

‘SUPERCHARGED’: From wildfires to heatwaves and flooding, scientists have warned that the El Niño weather pattern could “amplify climate extremes” in 2026, reported Climate Home News. There is an 82% chance of a “very strong” El Niño forming this year, according to the average of four weather forecasters cited by the Times. The Independent added that the phenomenon could be “supercharged” by another weather pattern – a positive Indian Ocean Dipole – raising the risks of fire, drought risks and other extreme weather events.

WORLD ON FIRE: Global fire outbreaks hit a “record high” in Africa, Asia and elsewhere this year, reported Reuters, with conditions expected to worsen to the “highest in recent history” if a strong El Niño “kicks in”. More than 150m hectares of land were damaged by fires from January to April – 20% more than the previous record – according to data compiled by the ​World Weather Attribution (WWA) research group cited by the newswire. 

  • ETHIOPIA EVS: Electric vehicles now account for 8% of Ethiopia’s car fleet as “soaring prices and fuel shortages compel” African countries to switch to “cleaner and cheaper transport”, according to the Associated Press. 
  • UK AID CUT: The UK has halved its most recent contribution to the UN’s Green Climate Fund (GCF) as part of a government “shift from development aid to military spending”, according to Climate Home News. The UK is no longer the top donor to the GCF following the move, said Carbon Brief.
  • TORT RETORT: Reuters reported that the New Zealand government plans to amend a key climate law, to prevent courts from holding private companies liable for climate harms. This would apply to “both current and future proceedings”, the newswire said, including a current case against six major emitters. 
  • RENEWABLE SECURITY: Military alliance NATO is “openly backing renewables and other non-fossil fuel sources of energy as key to the alliance’s security” despite US scepticism, reported Politico. The outlet covered a NATO-backed study that highlighted how imported fuels have been used as a “bargaining chip” in conflicts.
  • NO INDIAN ‘LOCKDOWN’: India’s oil-and-gas minister “dismissed concerns of any imminent lockdown-like restrictions” after prime minister Narendra Modi “urged citizens” to adopt fuel-saving measures amid a global energy crisis, reported the Economic Times.

One billion barrels

The volume of oil the world has lost over the past two months since Iran began its blockade of the strait of Hormuz following attacks by the US and Israel, according to Saudi Aramco CEO Amin Nasser, quoted in Reuters.


  • Antarctic sea ice levels have plummeted to “record-low anomalies” since 2015, with researchers calling it “one of the largest present-day climatic shifts in the Earth system” | Science Advances 
  • Rainfall reductions in the southern Amazon will occur at progressively lower levels of deforestation as the planet warms, indicating that “climate change amplifies the sensitivity of rainfall to forest loss” | Global Ecology and Biogeography 
  • Economic inequality adds more than 100,000 deaths to the total toll from heat and cold in Europe | Nature Health

(For more, see Carbon Brief’s in-depth daily summaries of the top climate news stories on Monday, Tuesday, Wednesday, Thursday and Friday.)

Chart showing that the UK car market 'over-complied' with the ZEV mandate in 2024

Contrary to claims by the UK car industry that demand is not high enough to meet the UK government’s sales targets for “zero emissions vehicles” (ZEVs), a new Carbon Brief factcheck found it has actually “overcomplied” with its mandate. The chart above shows the required (left) and achieved (right) share of ZEVs in total UK car sales in 2024, the latest figures available. “Flexibilities” (in light blue) include the sale of lower-emission petrol cars.

Chennai’s gig workers race against the heat

This week, Carbon Brief visits one of India’s first air-conditioned lounges designed to help gig workers deal with extreme heat.

An air-conditioned lounge for gig workers in Chennai’s T Nagar shopping district. Credit: Ishan Tankha / Scorched

On a single day in late April, 20 of the world’s hottest cities were all in India.

Chennai was not on the list this time, but is no stranger to high temperatures. In the south-eastern coastal capital of Tamil Nadu, extreme humidity and heat are inescapable facts of life.

“The heat is by no means manageable, but we have no choice but to deal with it,” said Mohammed S, a 29-year-old grocery platform delivery worker, speaking to Carbon Brief. 

Last year, Chennai became India’s first ever city to roll out air-conditioned lounges for millions of gig workers, like Mohammed, navigating India’s increasingly hotter cities. 

Lounge access

In the dense shopping district of T Nagar – recognised as an “urban heat island” – studded with silk sari and jewellery shops, an unassuming oblong container-like structure stands out.

Gig workers leave their slippers outside the lounge. Credit: Ishan Tankha / Scorched

Through the building’s tinted windows, workers wearing synthetic jerseys emblazoned with food delivery app logos are stretched out on wooden benches meant to seat 25 people. 

The lounge has charging points for phones, a water cooler and a unisex toilet. It might not seem like much, but workers tell Carbon Brief that it has made a “huge difference” to their lives – even on a day when the air conditioner stopped working. 

“Before this, life was very difficult,” said Mohammed. He continued:

“We would park our [electric] bikes and try to find a tree to sleep under, stop for tea and tea shop owners would tell us we couldn’t sit there for more than 10 minutes, try to rest in a building’s stairwell and be chased away, then try to find shade under a flyover. Now we can sit in the AC and avoid the worst of the heat.”

Dinesh, 27, said his day starts at dawn before the sun is up, picking up packages from companies in north Chennai – another critical heat hotspot.

For the next seven hours, there is no “off point” or breaks for Dinesh as apps rush deliveries. 

Some of Chennai’s gig workers told Carbon Brief they try to avoid the worst of afternoon temperatures from noon to 3pm, but for many – especially migrant workers – sitting back in the lounge is not a choice they can afford. One of them explained:

“If you don’t have cash to cover your bills or have to send money back home, you head out into the heat for a 12-hour shift and hope for the best.”

Dinesh checks his orders in the gig worker’s lounge. Credit: Ishan Tankha / Scorched

Feeling ‘gear’

In Chennai, heat might be normalised, but it has its own vocabulary. Speaking to Carbon Brief, the city’s gig workers, auto rickshaw drivers and fish sellers used an all-encompassing term – “gear” – to describe their symptoms, including dizziness, exhaustion and nausea. 

Last summer, researchers offered Delhi’s gig workers a Rs 200 (roughly £2) cash transfer on the first day of a heatwave, to provide them with a means to achieve “real-time” adaptation to heat risk. Workers who received a cash transfer reported fewer heat-related symptoms, according to the study.  

Asked if they would accept similar incentives to stay home on 40C days, workers in the T Nagar lounge expressed disbelief. Dinesh – who also trains technicians on how to repair air conditioners to support his income – told Carbon Brief:

“They [the apps] offer us incentives to go out in the heat when there are fewer riders.” 

Barring a few, none of the dozens of outdoor workers Carbon Brief spoke to had an air conditioner at home or in their hostels, making the lounge the only place they could cool down. 

THE BIG ‘LOSER’: Writing in Foreign Affairs, Princeton University’s Prof Benjamin Bardlow argued that Beijing “may emerge from the war in Iran as its winner – and Washington its ultimate loser”.

CARBON ‘KINGPIN’: A new podcast by Drilled followed Bruce Rastetter – a corn ethanol “kingpin-turned-carbon entrepreneur” from Iowa – now promoting biofuels and carbon-capture projects in Brazil.
OPEC ‘DRAMA KINGS’: An episode of the Polycrisis podcast, titled “Gulf drama kings”, dug into the UAE’s announcement that it was quitting oil producers’ cartel OPEC, asking whether this reflected “doom” for the group, geopolitical tensions, or “different beliefs” about the future of oil.

DeBriefed is edited by Daisy Dunne. Please send any tips or feedback to [email protected].

This is an online version of Carbon Brief’s weekly DeBriefed email newsletter. Subscribe for free here.

Categories
Energy

Factcheck: US and Iran are world’s only major emitters without net-zero targets

Many right-leaning figures have tried to push the idea that the UK is an outlier on net-zero.

Conservative leader Kemi Badenoch has claimed that other countries are “not following us” in aiming to cut emissions to net-zero, while GB News owner Paul Marshall said in March that the UK is “pursuing a path of unilateral economic disarmament”.

Both are among those on the right of UK politics who have falsely claimed that the UK’s net-zero target is “unilateral” and that this is a reason why the goal should be abandoned.

However, these claims ignore that 140 of the world’s 198 countries (71%) have net-zero targets. 

In fact, Iran and the US are the only two of the world’s top 20 carbon dioxide (CO2) emitters that lack a net-zero target, as shown in the map below.

If the UK were to scrap its net-zero target, as called for by both the opposition Conservatives and hard-right Reform UK, this is the group of major emitters it would be joining.

Countries with net-zero targets, as of May 2026.
Countries with net-zero targets, as of May 2026. Data source: Net Zero Tracker

The latest assessment report from the Intergovernmental Panel on Climate Change (IPCC), the world’s foremost authority on climate science, said the only way to stop global warming was to reach net-zero CO2 emissions.

The UK was the first major economy to set a net-zero target in 2019.

Since then, almost all of the world’s major emitters have followed suit, with China announcing a net-zero target in 2020 and India, Saudi Arabia and Russia launching goals in 2021.

Around 74% of global emissions are now covered by some kind of national net-zero target, according to data from the Net Zero Tracker, a consortium tracking net-zero policies.

According to the Net Zero Tracker, 34 nations – including the UK – have set a net-zero target into law, signifying the highest possible level of commitment.

In addition, 63 nations have stated their goal in a policy document, 16 nations have made a net-zero “pledge” and 23 nations have a net-zero “proposal”. (Four nations have declared that they have already reached net-zero.)

Types of net-zero targets across countries.
Types of net-zero targets across countries. Data source: Net Zero Tracker

The US, the world’s largest historical emitter when counting its cumulative climate impact since the start of the industrial revolution, had a net-zero target under former president Joe Biden. However, it was abandoned by the current Trump administration.

Despite this, some 18 regions and 43 cities in the US still have some form of net-zero commitment, according to the Net Zero Tracker.

John Lang, lead of the Net Zero Tracker, tells Carbon Brief:

“Ironically, of the world’s 20 largest emitters, only the US and Iran lack net-zero targets – precisely as the Iran crisis exposes the risks of dependence on fossil fuels and volatile oil markets.

“Arguing against net-zero is arguing for greater exposure to geopolitical instability and energy price shocks. The UK has already shown that cutting fossil-fuel dependence can go hand in hand with economic growth, reducing emissions by 54% since 1990 while almost doubling the size of the economy.”

Categories
Energy

New coal plants hit ‘10-year’ global high in 2025 – but power output still fell

The number of new coal-fired power plants built around the world hit a “10-year high” in 2025, even as the global coal fleet generated less electricity, amid a “widening disconnect” in the sector. 

That is according to the latest annual report from Global Energy Monitor (GEM), which finds that the world added nearly 100 gigawatts (GW) of new coal-power capacity in 2025, the equivalent of roughly 100 large coal plants.

It adds that 95% of the new coal plants were built in India and China. 

Yet GEM says that the amount of electricity generated with coal fell by 0.6% in 2025 – with sharp drops in both China and India – as the fuel was displaced by record wind and solar output, among other factors. 

The report notes that there have been previous dips in output from coal power and there could still be ups – as well as downs – in the near term.

For example, nearly 70% of the coal-fired units scheduled to retire globally in 2025 did not do so, due to postponements triggered by the 2022 energy crisis and policy shifts in the US.

However, GEM says that the underlying dynamics for coal power have now fundamentally shifted, as the cost of renewables has fallen and low usage hits coal profitability.

China and India dominate growth

In 2025, coal-capacity growth hit a 10-year high, with 97 gigawatts (GW) of new power plants being added, according to GEM.

(Capacity refers to the potential maximum power output, as measured in GW, whereas generation refers to power actually generated by the assets over a period of time, measured in gigawatt hours, GWh.)

This is the highest level since 2015 when 107GW began operating, as shown in the chart below. This makes 2025 the second-highest level of additions on record. 

Four charts showing that new coal plants hit '10-year high' in 2025
Coal-fired power capacity that began operation each year from 2000 to 2025, GW. Source: Global Energy Monitor.

The majority of this growth came from China and India, which added 78GW and 10GW, respectively, against 9GW from all other countries. 

Yet GEM points out that, even as coal capacity in China grew by 6%, the output from coal-fired power plants actually fell 1.2%. This means that each power plant would have been running less often, eroding its profitability. Similarly, capacity in India grew by 3.8%, while generation fell by 2.9%.

China and India had accounted for 87% of new coal-power capacity that came into operation in the first half of 2025. The shift up to 95% in the year as a whole highlights how increasingly just those two countries dominate the sector, GEM says.

Christine Shearer, project manager of GEM’s global coal plant tracker, said in a statement: 

“In 2025, the world built more coal and used it less. Development has grown more concentrated, too – 95% of coal plant construction is now in China and India, and even they are building solar and wind fast enough to displace it.”

Both China and India saw solar and wind meet most or all of the growth in electricity demand last year. 

Analysis for Carbon Brief last year showed that, in the first six months of 2025 alone, a record 212GW of solar was added in China, helping to make it the nation’s single-largest source of clean-power generation, for example. 

However, the country continues to propose new coal plants. In 2025, a record 162GW of capacity was newly proposed for development or reactivated, according to GEM. This brought the overall capacity under development in the country to more than 500GW. 

China’s 15th “five-year plan”, covering 2026-2030, had pledged to “promote the peaking” of coal use, while a more recent pair of policies introduced stricter controls on local governments’ coal use. 

For its part, in India some 28GW of new coal capacity was newly proposed or reactivated last year, bringing the total under development to 107.3GW and under-construction capacity to 23.5GW.

The Indian government is planning to complete 85GW of new coal capacity in the next seven years, even as clean-energy expansion reaches levels that could cover all of the growth in electricity demand. 

Outside of China and India, GEM says that just 32 countries have new coal plants under construction or under development, down from 38 in 2024. 

Countries that have dropped plans for new coal in 2025 include South Korea, Brazil and Honduras, it says. GEM notes that the latter two mean that Latin America is now free from any new coal-power proposals. 
This means that both electricity generation from coal and the construction of new coal-fired power plants are increasingly concentrated in just a few countries, as the chart below shows.

Two charts showing that the top 10 countries for coal-fired electricity also dominate plans for new capacity
Top 10 countries for total operating coal power-plant capacity (left) and for newly added capacity (right), GW. Source: Global Energy Monitor.

Indonesia’s coal fleet grew by 7% in 2025 to 61GW, with a quarter of the new capacity tied to nickel and aluminium processing, according to GEM. 

Turkey – which is gearing up to host the COP31 international climate summit in November – has just one coal-plant proposal remaining, down from 70 in 2015. 

The amount of new coal capacity that started to operate in south-east Asia fell for the third year in a row in 2025, according to GEM. 

Countries in south Asia that rely on imported energy are increasingly looking to other technologies to protect themselves from fossil-fuel shocks, such as Pakistan, which is rapidly deploying solar, states the GEM report.

In Africa, plans for new coal capacity are concentrated in Zimbabwe and Zambia, the report shows, with the two countries accounting for two-thirds of planned development in the region.

‘Persistence of policies’

While new coal plants are still being built and even more are under development, GEM notes that the global electricity system is undergoing rapid changes.

Crucially, the growth of cheap renewable energy means that new coal plants do not automatically translate into higher electricity generation from coal.

Without rising output from coal power, building new plants simply results in the coal fleet running less often, further eroding its economics relative to wind and solar power.

Indeed, GEM notes that electricity generation from coal fell globally in 2025. Moreover, a recent report by thinktank Ember found that renewable energy overtook coal in 2025 to become the world’s largest source of electricity.

GEM notes that coal generation may fluctuate in the near term, in particular due to potential increases in demand driven by higher gas prices. 

It adds that gas price shocks, such as the one triggered by the Iran war, can cause temporary reversals in the longer-term shift away from coal.

According to Carbon Brief analysis, at least eight countries announced plans to either increase their coal use or review plans to transition away from coal in the first month of the Iran war. However, a much-discussed “return to coal” is expected to be limited.

GEM’s report highlights that global fossil-fuel shocks can have an impact on the phase out of coal capacity over several years.

In the EU, for example, 69% of planned retirements did not take place in 2025, due to postponements that began in the 2022-23 energy crisis triggered by the Russian invasion of Ukraine, according to the report. Countries across the bloc chose to retain their coal capacity amid gas supply disruptions and concerns about energy security.

Yet coal-fired power generation in the bloc is now more than 40% below 2022 levels. Again, this highlights that coal capacity does not necessarily translate into electricity generation from coal, with its associated CO2 emissions.

Overall, GEM notes that “repeated exposure to fossil-fuel price volatility is as likely to accelerate the shift toward clean energy as it is to delay it”.

GEM’s Shearer says in a statement: 

“The central challenge heading into 2026 is not the availability of alternatives, but the persistence of policies that treat coal as necessary even as power systems move increasingly beyond it.”

In the US, 59% of planned retirements in 2025 did not happen, according to GEM. This was due to government intervention to keep ageing coal plants online. 

Five coal-power plants have been told to remain online through federal “emergency” orders, for example, even as the coal fleet continues to face declining competitiveness. 

Keeping these plants online has cost hundreds of millions of dollars and helped drive an annual increase in the average US household electricity prices of 7%, according to GEM. 

Despite such measures, Trump has overseen a larger fall in coal-fired power capacity than any other US president, according to Carbon Brief analysis. 

Meanwhile, according to new figures from the US Energy Information Administration, solar and wind both set new records for energy production in 2025.

Despite challenges with policy and wider fossil-fuel impacts, the underlying dynamic has shifted, says GEM, as “clean energy becomes more competitive and widely deployed” around the world. 

It adds that this raises the prospect of “a more sustained decoupling between coal-capacity growth and generation, particularly if clean-energy deployment continues at current rates”.