
By Andy May
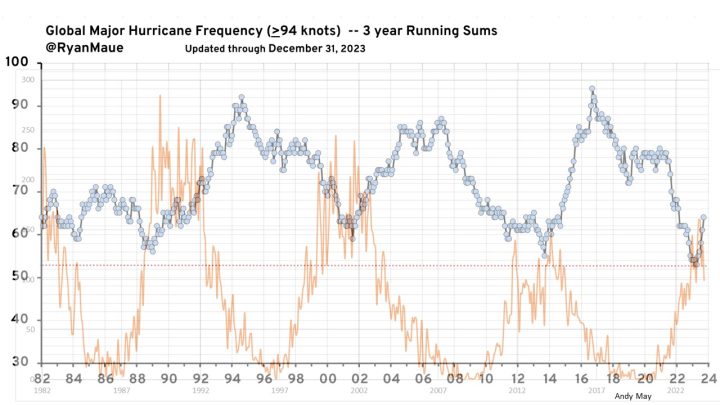
Yesterday, Roger Pielke Jr. posted a plot of the 3-year frequency of global major hurricanes (he uses a simple count of them) created by Ryan Maue (@RyanMaue). Dr. Maue also posted this plot on his twitter feed here. I noticed it looked like an inverse sunspot plot and overlaid the SILSO monthly sunspot count. In the figure, the blue is Maue’s plot, and the orange is a plot of monthly SILSO sunspots. The correlation, or strictly speaking, the anti-correlation is obvious and very interesting. I don’t think Ryan Maue’s plot has been formally published yet.
It appears that some extreme weather is influenced by changes in solar activity.
OK, I’ll speculate.
Sunlight penetrates deeply (up to 1,000 meters) into the ocean before it is absorbed. Greenhouse gas radiation cannot penetrate the ocean surface. The residence time of sunlight energy is longer as a result. This magnifies solar changes since Watt-for-Watt changes in sunlight matter more than changes in greenhouse gases.
Storms are a function of temperature differences, when an imbalance (increase in energy storage) happens in the tropics at the top of the solar cycle, the temperature difference between the tropics and the mid-latitudes increases. This causes storminess and hurricanes to increase, the increase doesn’t stop until the next solar minimum. Solar peaks appear to initiate an increase in storminess. Just a guess, take it for what it’s worth.
